I worked on this project shortly after a string of wildfires in Northern California. A wildfire happened 1 mile away from my home and wildfires were dominating the news cycle. I wanted to explore California wildfire data to see if fires were truly increasing or if my experience was simply anecdotal. The project was done mainly using Pandas and Seaborn in Python.
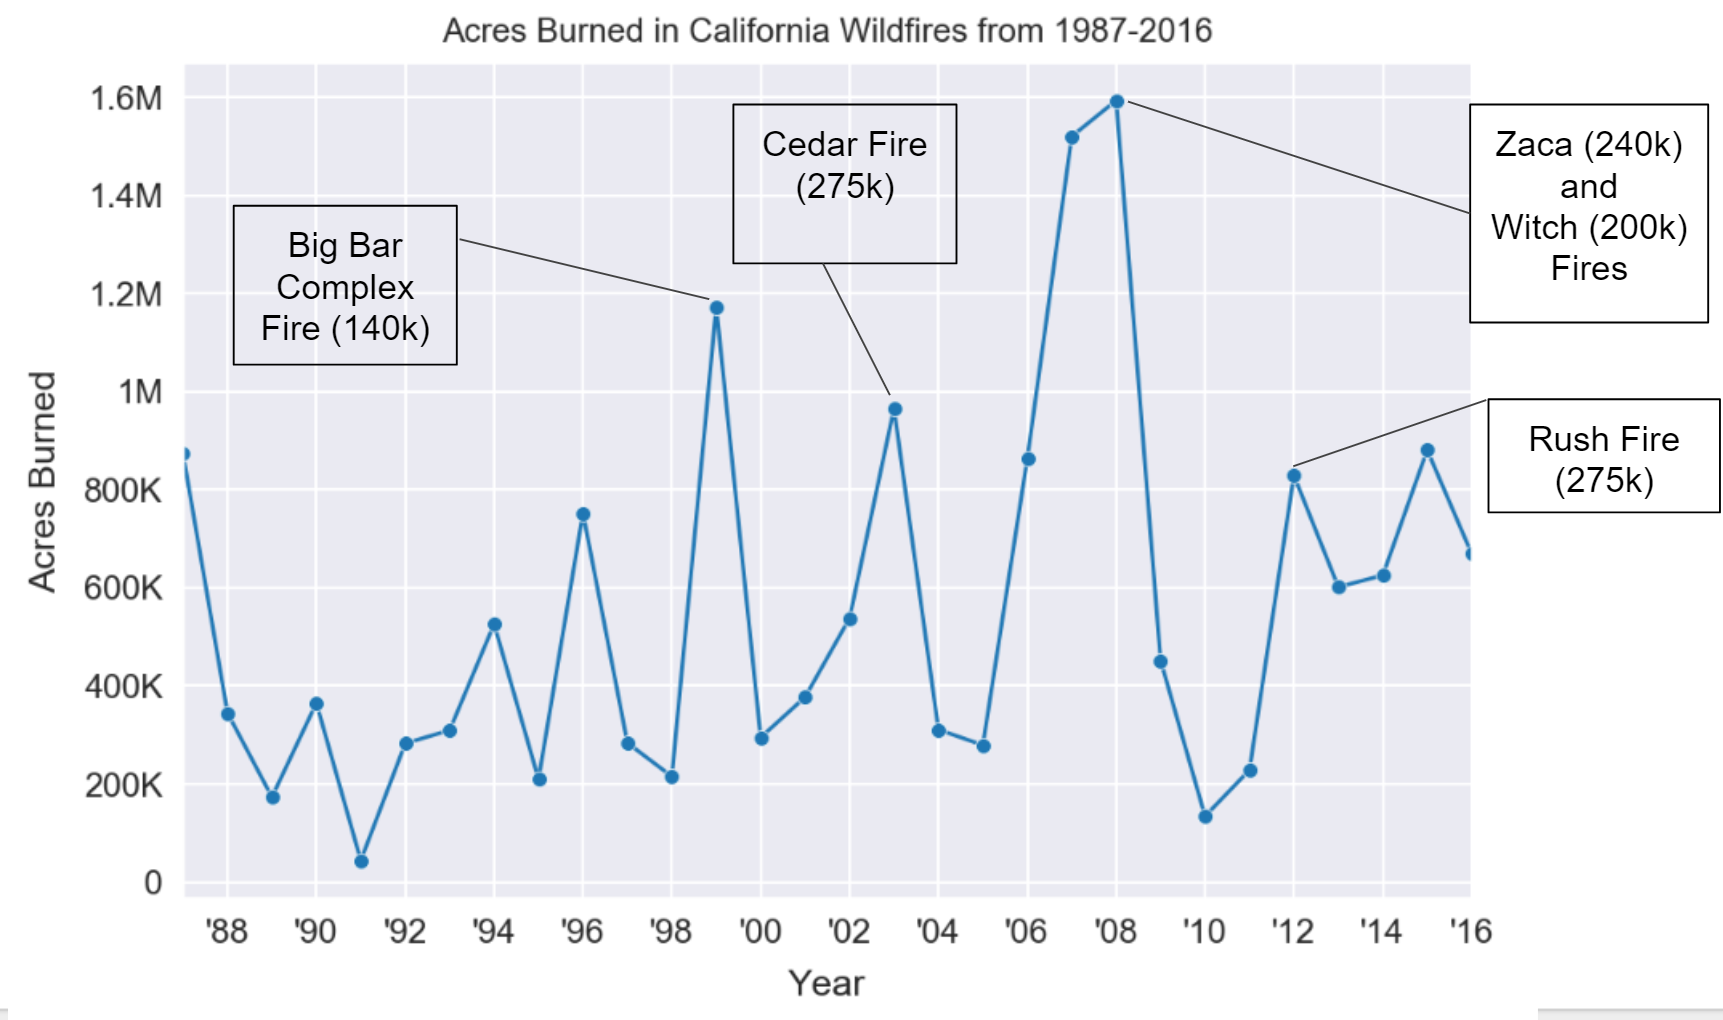
In terms of acres burned, there is an increasing trend of wildfires Year over Year. A spike in acres burned generally corresponds to a large (defined as top 20 in the history of CA) wildfire occurring that year.
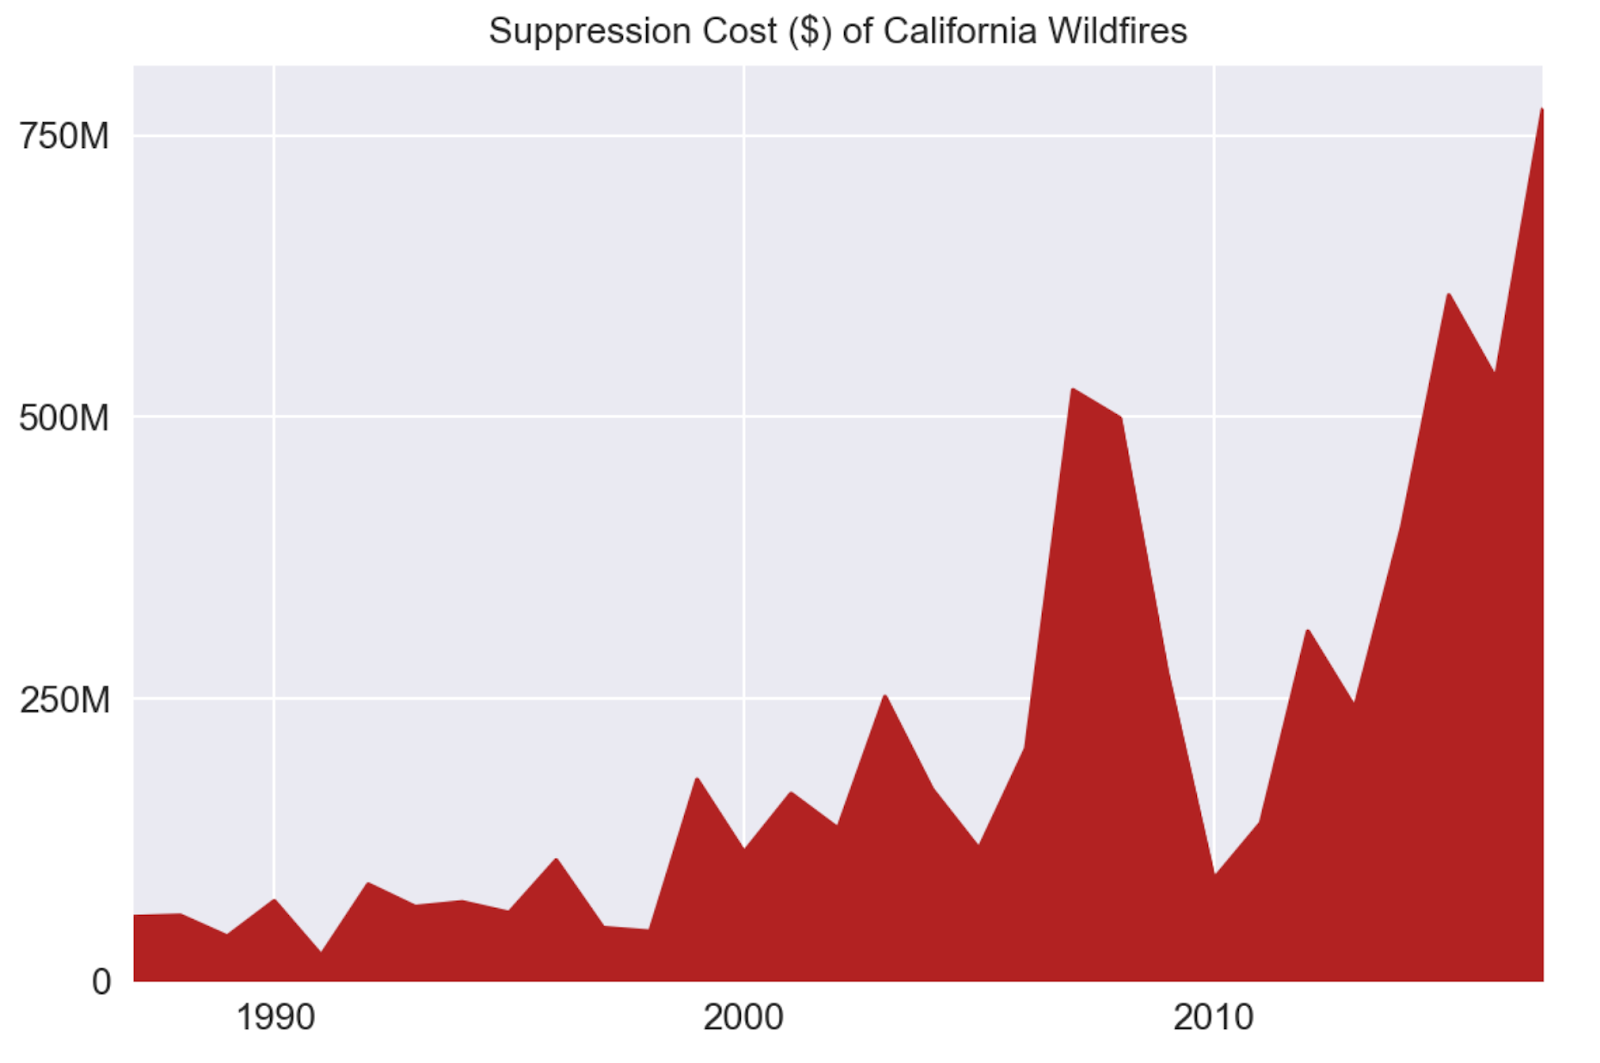
Year over Year suppression costs (cost of putting wildfires out) show a a much clearer increasing trend. Suppression costs in recent years are higher than they have ever been. Costs in 2016 were approximately 3x higher than costs in 2012.
I would like to expand the analysis to include a comparison of Large (acreage) vs. Destructive ($ damage) wildfires, I would like to generate a heatmap on an interactive map of California, and I would like to explore trends in the time of day and month of year of wildfires.
- http://www.fire.ca.gov/fire_protection/fire_protection_fire_info_redbooks_2016 (2016 Data)
- http://cdfdata.fire.ca.gov/incidents/incidents_statsevents (YoY Data)
https://nbviewer.jupyter.org/github/kiran-a-singh/CA-Wildfires-Visuals/blob/master/Cal%20Fires.ipynb