
Using the Binance cryptocurrency exchange API client BTC data were obtained and examined, culminating in the construction of five distinct regression models to predict next day's close price as a function of its inferred financial market indicator statistics. Three were built using linear regression algorithms: Ordinary Least Squares (OLS), Lasso, and Ridge. One was built using the Random Forest Regression (RFR) algorithm. Then last, one was built using a Long Short Term Memory(LSTM) recurrent neural network.
- Approach
- Findings
- Future Work
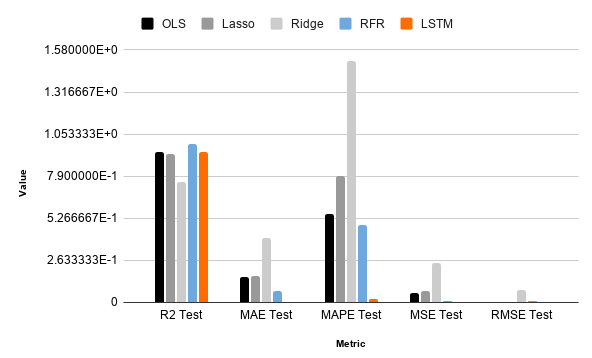
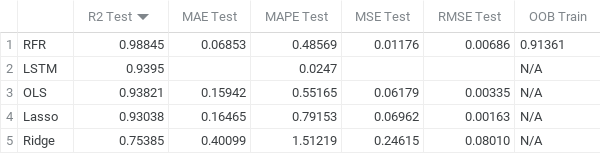
We found that the RFR model produced the most accurate predictions regarding BTCs closing price. However, the R2 score of the training set for the RFR was substantially lower (0.9172). The concern is solved by computing its OOB (out-of-bag) score, which was 0.9136. Comparing that score to the train R2 (0.9172) we can see how similar they are. Since the OOB is an unbiased estimate of a model’s performance on a test set the same size as the training, we can confirm that the model produces relatively "true" predictions, solidifying its test R2 score of 0.98845.
That being said, the LSTM produced the second best results according to R2 scores (0.9395). Although, because we split the train/test sets differently (80/20) than regression models (75/25) the R2 metric might not be useful for a comparitive analysis between the two. Using MAPE proves more reliable in that regard, showing us that the LSTM prediction errors were smaller by 0.0247 compared to RFR (0.48569).
The OLS and Lasso frameworks produced nearly identical results. Their respective R2 testing scores were 0.93821 and 0.93038, differing by only 0.00783 points. However, when looking at their MAPEs we can see that the OLS received a much better score than Lasso by 0.23988 meaning the OLS model produced more accurate predictions compared to the actual values. Lastly, the Ridge model performed the worst across the board, only receiving an R2 score of 0.75385 and a terrible MAPE in comparison to 1.51219. Meaning that this model's predictions differed from the actual values during testing by over 1% even with the data normalized and scaled.
- Perform deeper analysis into Tweet sentiment
- Train/test models on more data
- Fine tune the hyperparameters of models
- Perform EDA with other indicators
- Implement signal generator
- Back test
- Compute prospective Sharpe Ratio
- Test for replicable results on different assets (equities, ETFs, etc.)