Skip to content
New issue

Have a question about this project? Sign up for a free GitHub account to open an issue and contact its maintainers and the community.

By clicking “Sign up for GitHub”, you agree to our terms of service and privacy statement. We’ll occasionally send you account related emails.

Already on GitHub? Sign in to your account

Reduce number of Map lookups in Graph-Specifics #1021

Open
wants to merge 6 commits into
base: master
Choose a base branch
from

Conversation

HannesWell
Copy link

While looking into the implementations of the graph-specifics I noticed some Map lookups that can be avoided. Reducing Map lookups improves the performance, which is why I would like to contribute these changes with this PR.

Map lookups are reduced by using Map's computeIfAbsent() or computeIfPresent() methods where applicable.
Furthermore I restructured some methods to avoid unnecessary method calls and take advantage of short-circuit logical operators (like in "UndirectedSpecifics.isEqualsStraightOrInverted()"), which in the end again avoids lookups.


Use Map's computeIfAbsent or computeIfPresent methods where applicable
to reduce Map look-ups, which improves performance.

To further reduce the number of Map look-ups, avoid unnecessary method
calls and take advantage of short-circuit logical operators (like in
"UndirectedSpecifics.isEqualsStraightOrInverted()").
@jsichi
Copy link
Member

jsichi commented Jan 1, 2021

Assigning this one to @d-michail to review.

Also, @HannesWell could you take a look at #958 regarding the need for private fields to avoid the cost of reconstructing Function objects?

@jsichi jsichi requested a review from d-michail January 1, 2021 10:08
@HannesWell
Copy link
Author

Yes, sure I will have a look at it.
I didn't knew about that issue, but it seems closely related to the topic of this PR and would be a good fit to be fixed with this PR.

@HannesWell
Copy link
Author

After John's comment and looking into #958 I did some benchmarks to further improve the runtime of graph-population. Additionally I sampled the benchmarks using JVisualVM (which is bundled with OpenJDK based JDKs) to find and improve the hotspots.

In the following I will present you the benchmark and the results and add some more commits to further reduce the runtime.

The benchmark repeatedly populates graphs in a loop using the CompleteGraphGenerator. I used this graph-generator in contrast to the one mentioned in #958, because it is behaviour is predictable and has no random elements. After a warm-up phase ten complete (directed and undirected) graphs are created and the runtime of each graph creation is measured. At the end the average runtime and relative sample variance is printed.

The code of the benchmark is the following:

public class TestClass
{
    private static final int VERTEX_COUNT = 3_000;

    private static final int WARMUP_RUNS = 3;
    private static final int MEASURED_RUNS = 10; // 10 - runtime-benchmarks/sampling, 3 - profiling

    public static void main(String[] args)
    {
        GraphGenerator<String, DefaultEdge, ?> gen = new CompleteGraphGenerator<>(VERTEX_COUNT);

        benchmarkUndirectedGraph(gen);
        benchmarkDirectedGraph(gen);
    }

    // use VM args: -Xms4g -Xmx4g.

    private static void benchmarkUndirectedGraph(GraphGenerator<String, DefaultEdge, ?> generator)
    {
        System.out.println(" - SimpleGraph(undirected)");

        Supplier<Graph<String, DefaultEdge>> graphSupplier =
            () -> new SimpleGraph<>(SupplierUtil.createStringSupplier(), DefaultEdge::new, false);

        warmUp(graphSupplier, generator);

        runBenchmark(graphSupplier, generator);
    }

    private static void benchmarkDirectedGraph(GraphGenerator<String, DefaultEdge, ?> generator)
    {
        System.out.println(" - SimpleDirectedGraph");

        Supplier<Graph<String, DefaultEdge>> graphSupplier = () -> new SimpleDirectedGraph<>(
            SupplierUtil.createStringSupplier(), DefaultEdge::new, false);

        warmUp(graphSupplier, generator);

        runBenchmark(graphSupplier, generator);
    }

    private static <E,
        V> void warmUp(Supplier<Graph<V, E>> graphSupplier, GraphGenerator<V, E, ?> graphGenerator)
    {
        System.out.println("Start warm-up");
        for (int i = 0; i < WARMUP_RUNS; i++) {
            Graph<V, E> graph = graphSupplier.get();
            graphGenerator.generateGraph(graph);
        }
        triggerAndWaitForGC();
        triggerAndWaitForGC();
    }

    private static <V, E> void runBenchmark(
        Supplier<Graph<V, E>> graphSupplier, GraphGenerator<V, E, ?> graphGenerator)
    {
        System.out.println("Start measured runs");
        long[] runtimes = new long[MEASURED_RUNS];
        for (int i = 0; i < MEASURED_RUNS; i++) {

            long start = System.currentTimeMillis();

            Graph<V, E> graph = graphSupplier.get();
            graphGenerator.generateGraph(graph);

            runtimes[i] = System.currentTimeMillis() - start;

            // release graph and trigger GC outside the timed region, so it hopefully runs less in
            // the timed section
            graph = null;
            triggerAndWaitForGC();
        }

        double mean = Arrays.stream(runtimes).average().getAsDouble();
        double sampleVariance = 0;
        for (long runtime : runtimes) {
            sampleVariance += Math.pow(runtime - mean, 2);
        }
        sampleVariance /= runtimes.length - 1;
        sampleVariance /= mean;
        System.out.println("\t" + "RUNTIME avrg: " + mean + "ms, rel-var: " + sampleVariance);
        System.out.println("\t" + Arrays.toString(runtimes));
    }

    private static final int GC_TIME = 500; // if the wait time is too low, benchmark-runtime grows

    private static void triggerAndWaitForGC()
    {
        System.gc();
        long start = System.currentTimeMillis();
        while ((System.currentTimeMillis() - start) < GC_TIME) { // just busy wait
        }
    }
}

@HannesWell
Copy link
Author

HannesWell commented Jan 16, 2021

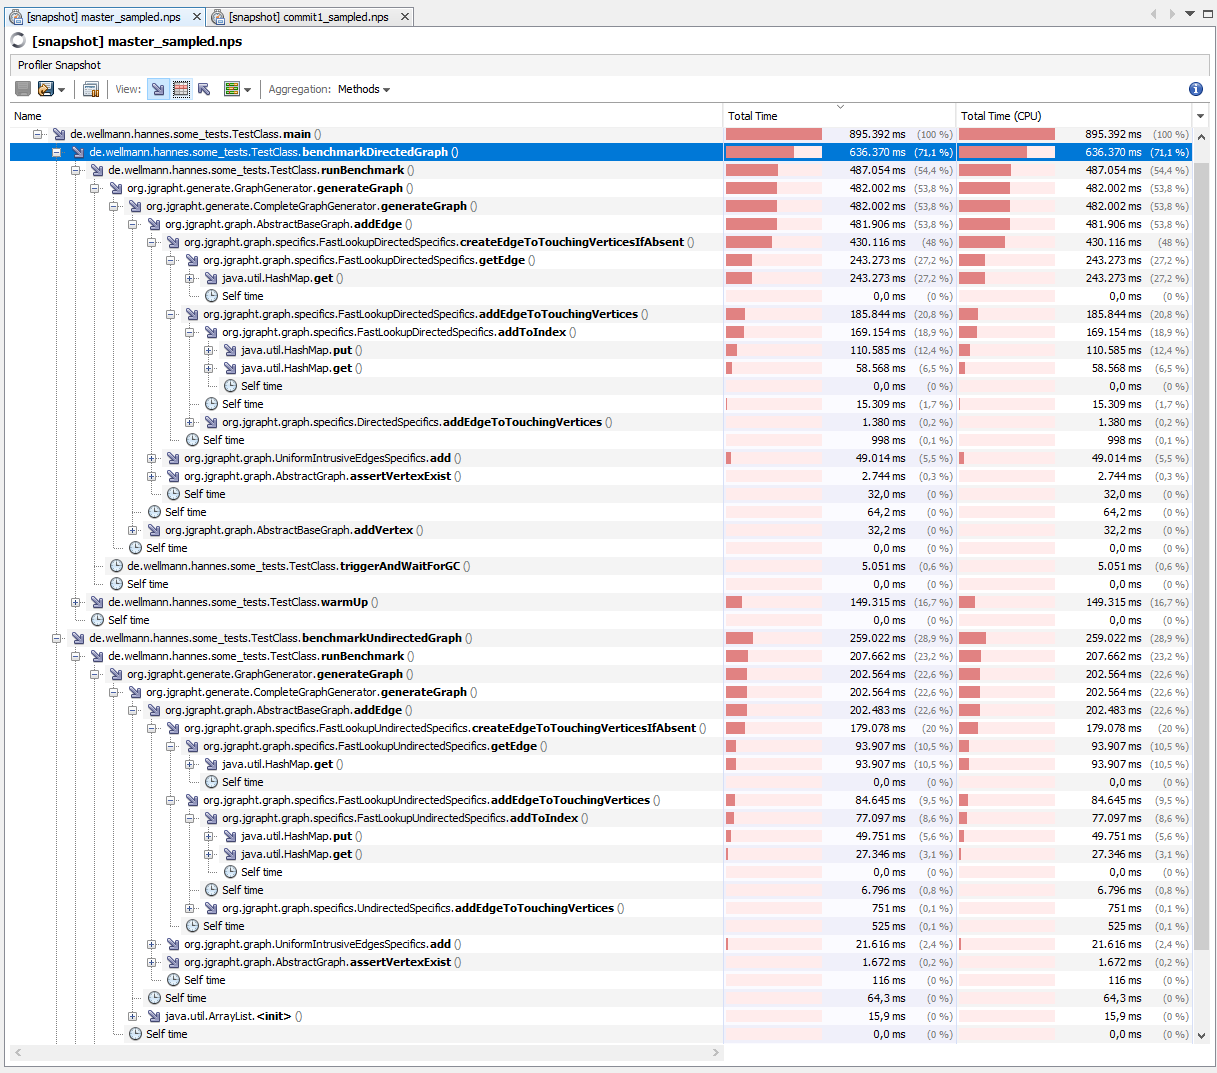
First I run the benchmark against the (then) current master (i.e. commit 64e8f1f from the 23th of dec 2020).

The benchmark is executed in "Run" mode of my Eclipse 2020-12 (Java-DSL-Tools), using the Java11 GraalVM CE 20.2.0 on my Windows 10 computer, which has a Intel Core i5-3750K@3,4Ghz (base) and 16GB RAM. All following benchmarks use the same setting.

Benchmark-results - master

The following runtimes are printed:

 - SimpleGraph(undirected)
	RUNTIME avrg: 19309.1ms, rel-var: 0.47472665
	[19213, 19216, 19286, 19282, 19224, 19237, 19471, 19334, 19446, 19382]
 - SimpleDirectedGraph
	RUNTIME avrg: 45722.5ms, rel-var: 0.37664534
	[45554, 45729, 45636, 45697, 45741, 45943, 45608, 45667, 45698, 45952]

The JVisualVM sampler showed the following results:

master_sampled_call-times

(I will attach the snapshots of all sampling sessions in the end as a zip-file because github does not support arbitrary files.)

The runtimes measured from within the code are a little bit higher with the sampler attached:

 - SimpleGraph(undirected)
	RUNTIME avrg: 20253.4ms, rel-var: 0.28024046442682327
	[20337, 20393, 20323, 20200, 20173, 20280, 20218, 20217, 20178, 20215]
 - SimpleDirectedGraph
	RUNTIME avrg: 48193.4ms, rel-var: 0.978120102199333
	[47971, 47982, 48387, 48105, 48028, 48243, 48075, 48102, 48424, 48617]

First of all the displayed sampler-results show that runtimes measured by the sampler and by the code itself are consistent. The total time the sampler recognised the code being in the generateGraph() method is almost exactly ten times the average runtime measured by the code (for both cases, directed and undirected). Also the time spend in triggerAndWaitForGC() is ten-times the specified wait-time of 500ms. The runtime of the runBenchmark() method is the runtime of all test-cases combined plus the GC-wait time plus runtime-measurement and printing (which is neglect-able).

Analysis
It is obvious that in both cases most of the time, almost 90% of the entire time to populate a complete graph is spend in the createEdgeToTouchingVerticesIfAbsent() method of the FastLookup-specifics and most of the time spend there is spend in HashMap operations.
The fraction the (Un-)DirectedSpecific.addEdgeToTouchingVertices() uses, is almost not worth to mention. I assume that the behaviour is similar in addEdgeToTouchingVerticesIfAbsent() of the FastLookup specifics.
So my further optimization focus on createEdgeToTouchingVerticesIfAbsent() respectively addEdgeToTouchingVerticesIfAbsent() of the FastLookup-specifics.

@HannesWell
Copy link
Author

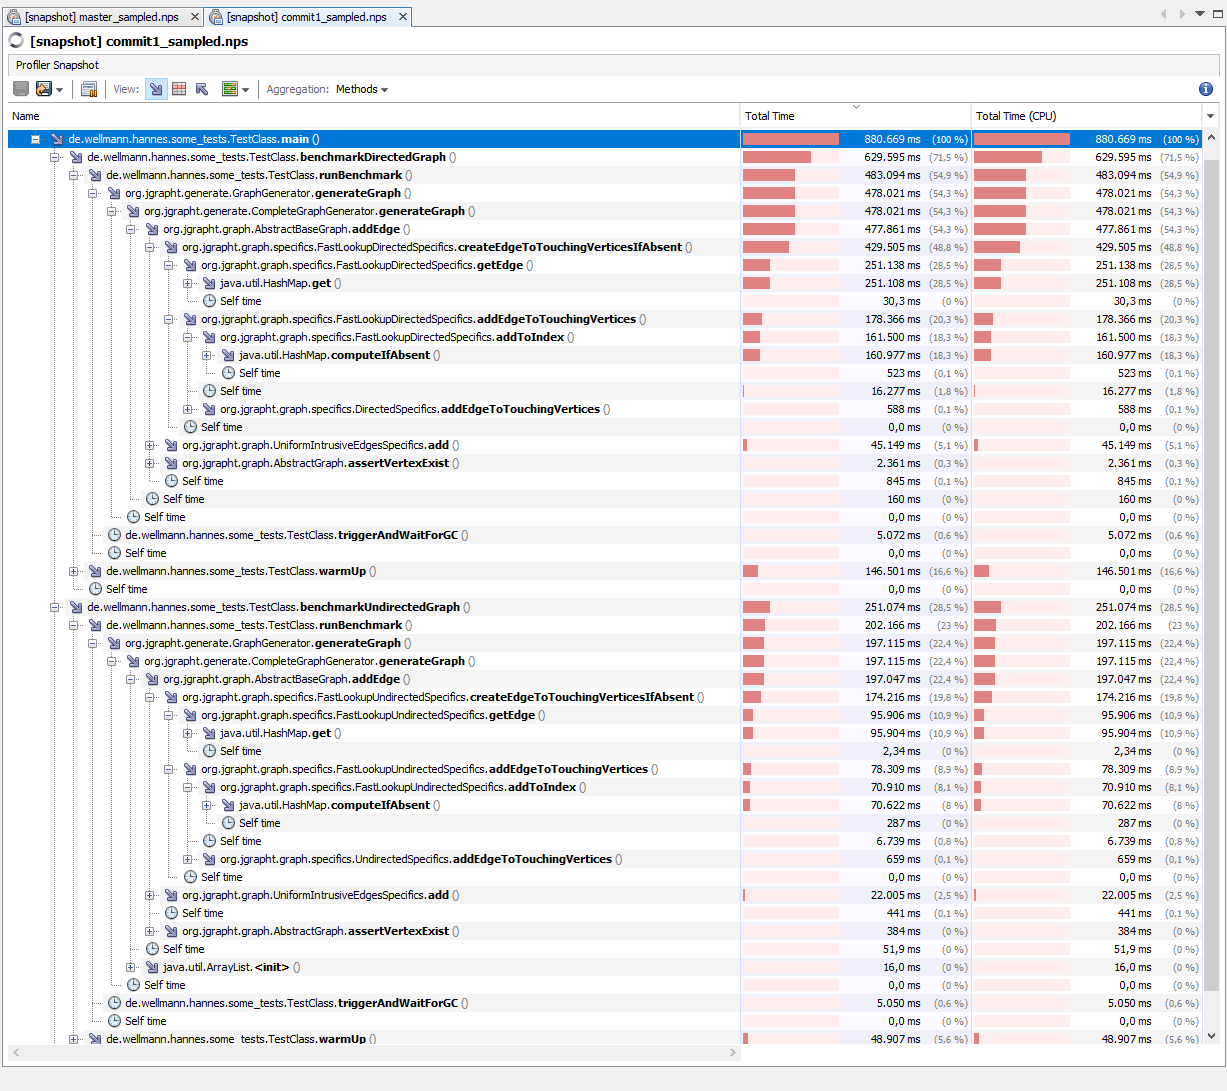
Second I did the same benchmark and sampling against the first commit of this PR.
These are the results:

Benchmark-results - commit 1
The printed runtimes are:

 - SimpleGraph(undirected)
	RUNTIME avrg: 19419.3ms, rel-var: 0.12697619836394153
	[19525, 19461, 19420, 19349, 19392, 19438, 19417, 19388, 19373, 19430]
 - SimpleDirectedGraph
	RUNTIME avrg: 46263.9ms, rel-var: 1.2478529575856
	[46161, 46180, 46196, 46932, 46253, 46226, 46118, 46102, 46248, 46223]

The JVisualVM sampler showed the following results:
commit1_sampled_call-times

With attached sampler the printed runtimes are the following:

 - SimpleGraph(undirected)
	RUNTIME avrg: 19704.1ms, rel-var: 0.23372969754179754
	[19765, 19736, 19832, 19750, 19661, 19686, 19714, 19635, 19615, 19647]
 - SimpleDirectedGraph
	RUNTIME avrg: 47799.4ms, rel-var: 0.9462750113553262
	[47733, 47834, 47768, 47883, 47785, 47759, 47824, 47534, 47561, 48313]

Analysis
One can see, that the current commit-1 does not really change the overall runtime. The sampler-results show that the runtime of addEdgeToTouchingVertices() of the FastLookup-specifics show a decreased runtime of around 5 percent. On the other hand some other runtimes go a little bit up. In general my experience is that the average times varies about a few percentage points.
So bottom line is, this commit-1 did not changed much, at least not in this case.

As a lookahead: summed up a lot of time is spend in the equals method of the Pair-implementation used by the FastLookup-Specifics. And using other vertex-types with Object-like equals() implementations dropped the runtimes significantly (in one quick measurement with a comparable setup the runtimes were around 5~6sec in average. I will do some more measurements later. But it already looks like the hashCode() and equals()-implementation significantly influences the runtime.

The problem was that the 'source' and 'target' field of IntrusiveEdge,
which are used in hashCode() and equals() of IntrusiveEdge, are changed
after an Edge is put into the map. Changing the fields considered in
hashCode() and equals() after the instance is put into a HastMap/-Set is
a bug in general.

The optimization of IntrusiveEdgesSpecifics has to be done more
specifically. But the IntrusiveEdgesSpecifics can be improved
independently of the other classes changed in this PR, so I will do it
in another PR (if the other approach works).
@HannesWell
Copy link
Author

HannesWell commented Jan 16, 2021

For the second commit I did the same benchmark and sampling again. I did it before reverting the buggy improvements of IntrusiveEdgesSpecifics. But this change didn't have a significant impact in the used case anyway.

Benchmark-results - commit 2
The printed runtimes are:

 - SimpleGraph(undirected)
	RUNTIME avrg: 16089.6ms, rel-var: 0.1534490188278971
	[16122, 16106, 16076, 16202, 16074, 16110, 16063, 16078, 16027, 16038]
 - SimpleDirectedGraph
	RUNTIME avrg: 39523.8ms, rel-var: 0.18781819786783882
	[39448, 39487, 39606, 39403, 39558, 39541, 39527, 39698, 39527, 39443]

commit2_sampled_call-times

With attached sampler the printed runtimes are the:

 - SimpleGraph(undirected)
	RUNTIME avrg: 16877.9ms, rel-var: 0.6997770259728204
	[17077, 16980, 16988, 16923, 16852, 16799, 16810, 16833, 16754, 16763]
 - SimpleDirectedGraph
	RUNTIME avrg: 40385.2ms, rel-var: 0.1729225337775005
	[40321, 40507, 40482, 40300, 40345, 40285, 40448, 40453, 40304, 40407]

Analysis

First of all we can see from the printed runtimes, that the overall runtime has decreased for about ~17% (undirected) respectively ~12% (directed). That's something but not very much. But, and I think this is important, now we can see the definite and absolute hotspot of populating the graph and it is the HashMap.computeIfAbsent() method. It consumes over 80% of the overall runtime. And the displayed time is the (approximate) time spend in this method. The runtime for creating the remappingFunction lambda passed to it counts into the self-time of createEdgeToTouchingVerticesIfAbsent(). As you can see most of the time spend in computeIfAbsent() is again spend in getTreeNode() respectively putTreeVal(). And these methods do not even contain the execution of the remappingFunction passed to computeIfAbsent().

From this I conclude, first that the suggested lambda-caching from #958 does not really help in this case and second, since the HashMap spends a lot of time in searching or putting TreeNode-Entries, which I see as a sign of overfull HashMap-buckets, I conclude that another cause for the long runtime could be that the hash-codes of the (Unordered-)Pairs are badly distributed. Another cause could be that the equals() methods of the Pair-implementation are too slow or that it could be worth to consider to allocate the touchingVerticesToEdgeMap with its expected size. But I'm not absolutely certain what's the cause and what is only a symptom.

Another thing I find interesting is that the time spend in the getEdge() method of the fast-lookups after the first commit did not vanish with the change from the second commit. After commit-1 there was also a computeIfAbsent() in addToIndex() which was called once per call to createEdgeToTouchingVerticesIfAbsent(), just like the getEdge() method. In commit-2 the getEdge() method was gone but the runtime of computeIfAbsent() increased. What's really interesting is, that the time spend in HashMap's putTreeVal() is almost the same in commit-1 and 2. So this is comparable but the runtime of the first HashMap.get() respectively getTreeNode() did not went to zero together with getEdge(), instead the time spend in getTreeVal() was increased in the second commit. So it seems like the JVM can somehow cache the result of the first get, or just all required data are in the CPU-caches, or something like this, so the second get (as part of computeIfAbsent()) is much quicker.

What also puzzles me, is that addEdgeToTouchingVertices() of the (Un-)UndirectedSpecifics spends so much less time in map-lookups even tough there are two per added edge. The difference is that the map accessed there uses the vertex-objects as key while the map in the FastLookup-Specifics uses a pair of two vertices. This leads me to the question, if it could be faster to use a table like Map<V,Map<V,Set<E>>, where the key of the outer map is the source and the key of the inner map is the target.

Maybe someone of you has another idea (or can say if I'm completely wrong anywhere).
I will continue my search, regarding the hashCode distribution. And will also improve the benchmark and include Object-vertices and also use MultiGraph's in order to test the runtime of addEdgeToTouchingVertices() of the FastLookup-Specifics too.

@jsichi
Copy link
Member

jsichi commented Feb 14, 2021

Could you merge from master? We had a problem with Travis CI, so pull requests weren't getting CI build runs.

Sign up for free to join this conversation on GitHub. Already have an account? Sign in to comment
Labels
None yet
Projects
None yet
Development

Successfully merging this pull request may close these issues.

None yet

2 participants