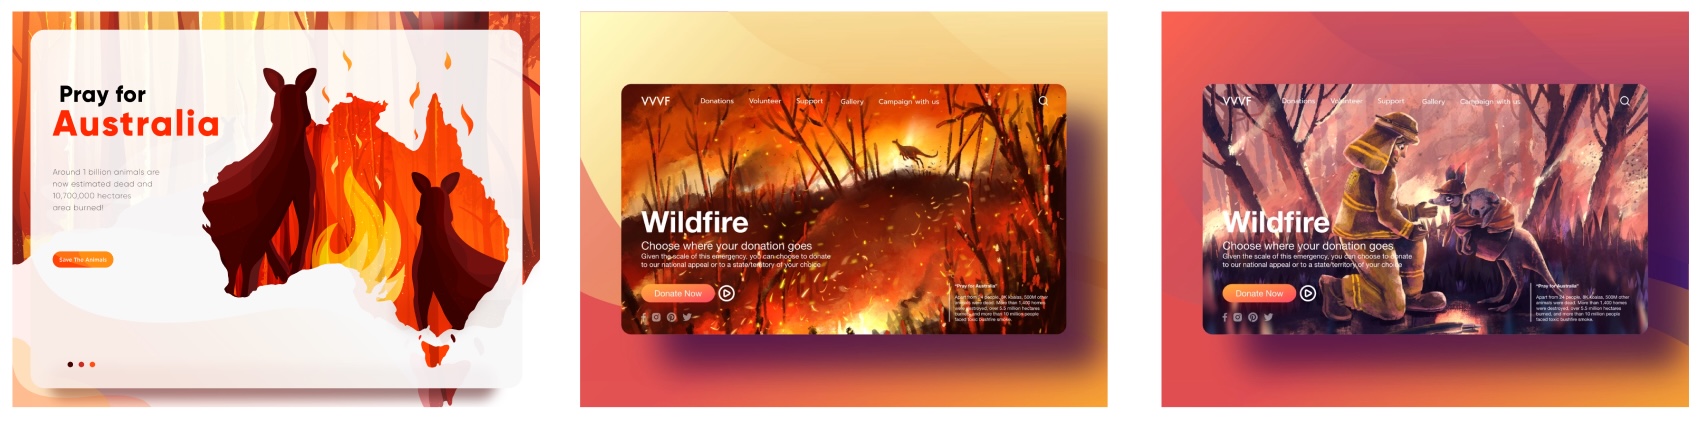
In recognition of National Fire Prevention Week wrapping up, my team decided to tackle the theme of environmental sustainability with a project dealing with
Latin for 'fire', ignis is a platform to prepare communities for wildfires to reduce the damage and impact of these natural disasters. As a team from California, one of the states that historically suffers the most from wildfires every Autumn, we have seen firsthand the havoc that wildfires can wreck, on both rural and urban communities alike. In fact, wildfires accounted for over $11.2 billion in damage across the United States(1).
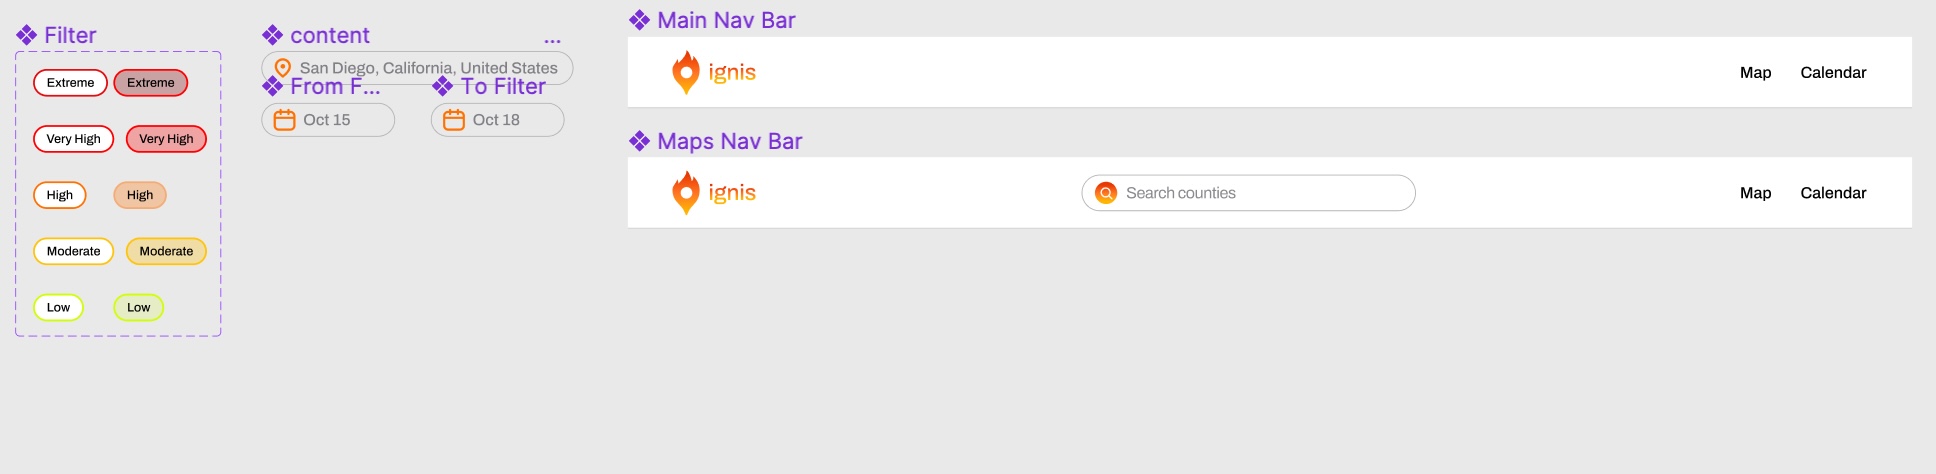
For our project, we utilized an interactive map interface to provide visualizations of curated wildfire information that we generated for each county in the United States. Fetching from our back-end and external APIs, we are able to display live and historical statistics of relevant weather information along with future machine-learning based predictions and tips to prepare communities in advance.
ignis was built by a mix of experienced hackers and first-time hackers in UI/UX design and full stack developer roles. It was built using a modern full-stack of cutting edge real industry technologies.


 Our tech flow.
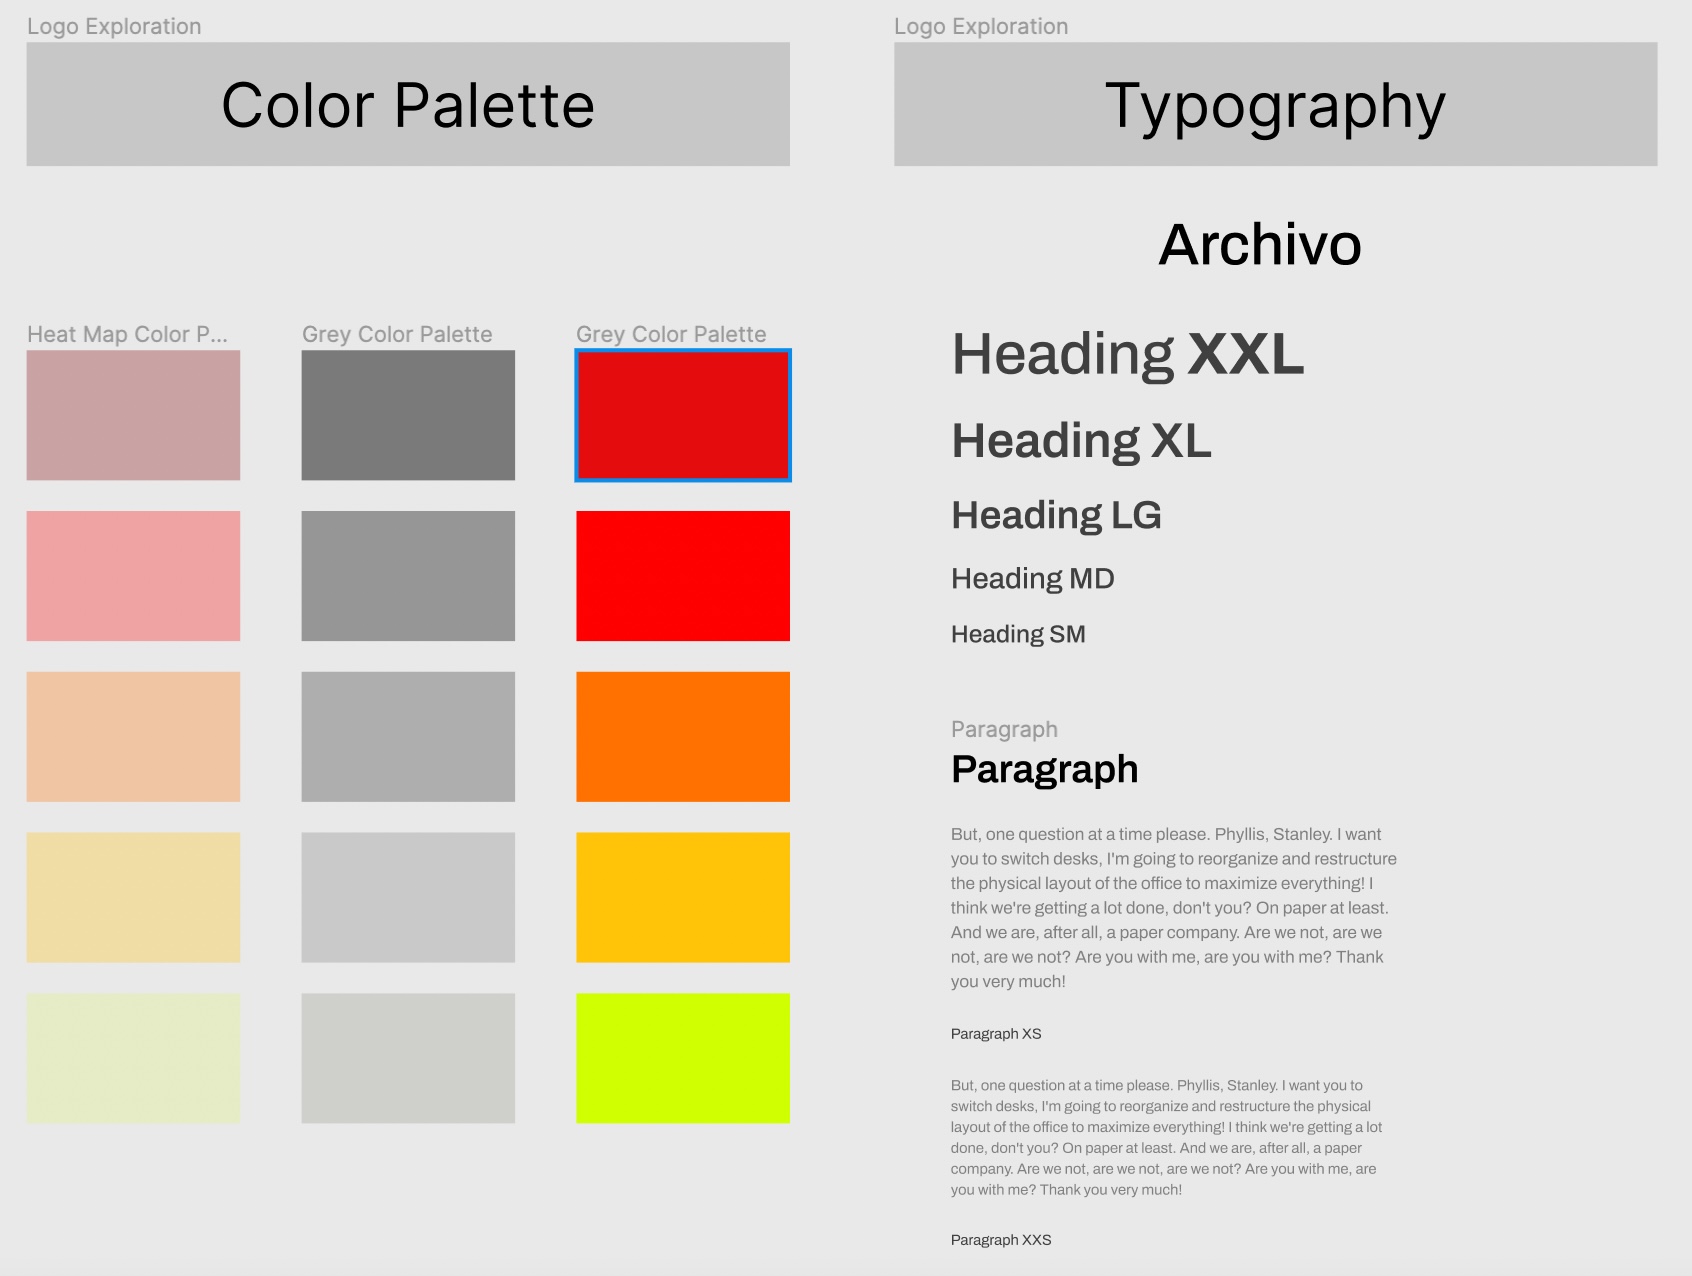
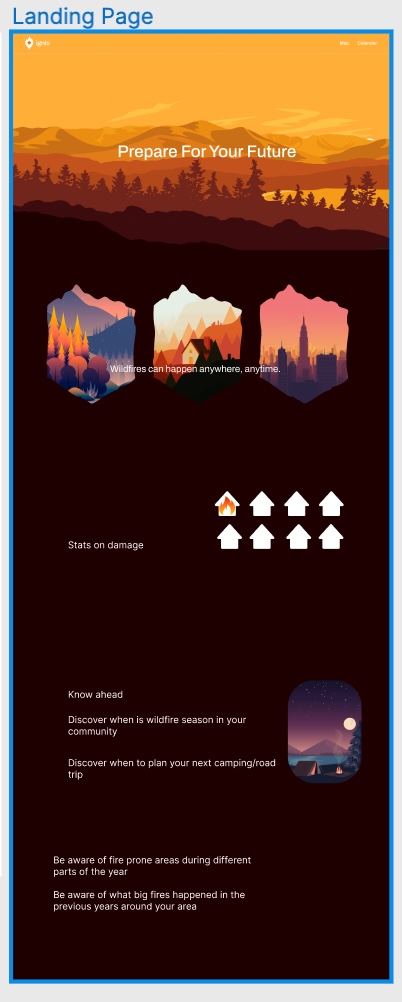
The frontend was built in React with Next.js to offer faster loading times and enrich user interactions along with TypeScript to develop a maintainable and structured codebase. The map was built with Mapbox, with various datasets overlayn on top of it. We also used Sass, HTML and CSS with Material UI to style and display the components of the frontend. The landing page was built using a parallax effect, by a team member who had never touched React, Next.js or Sass before.
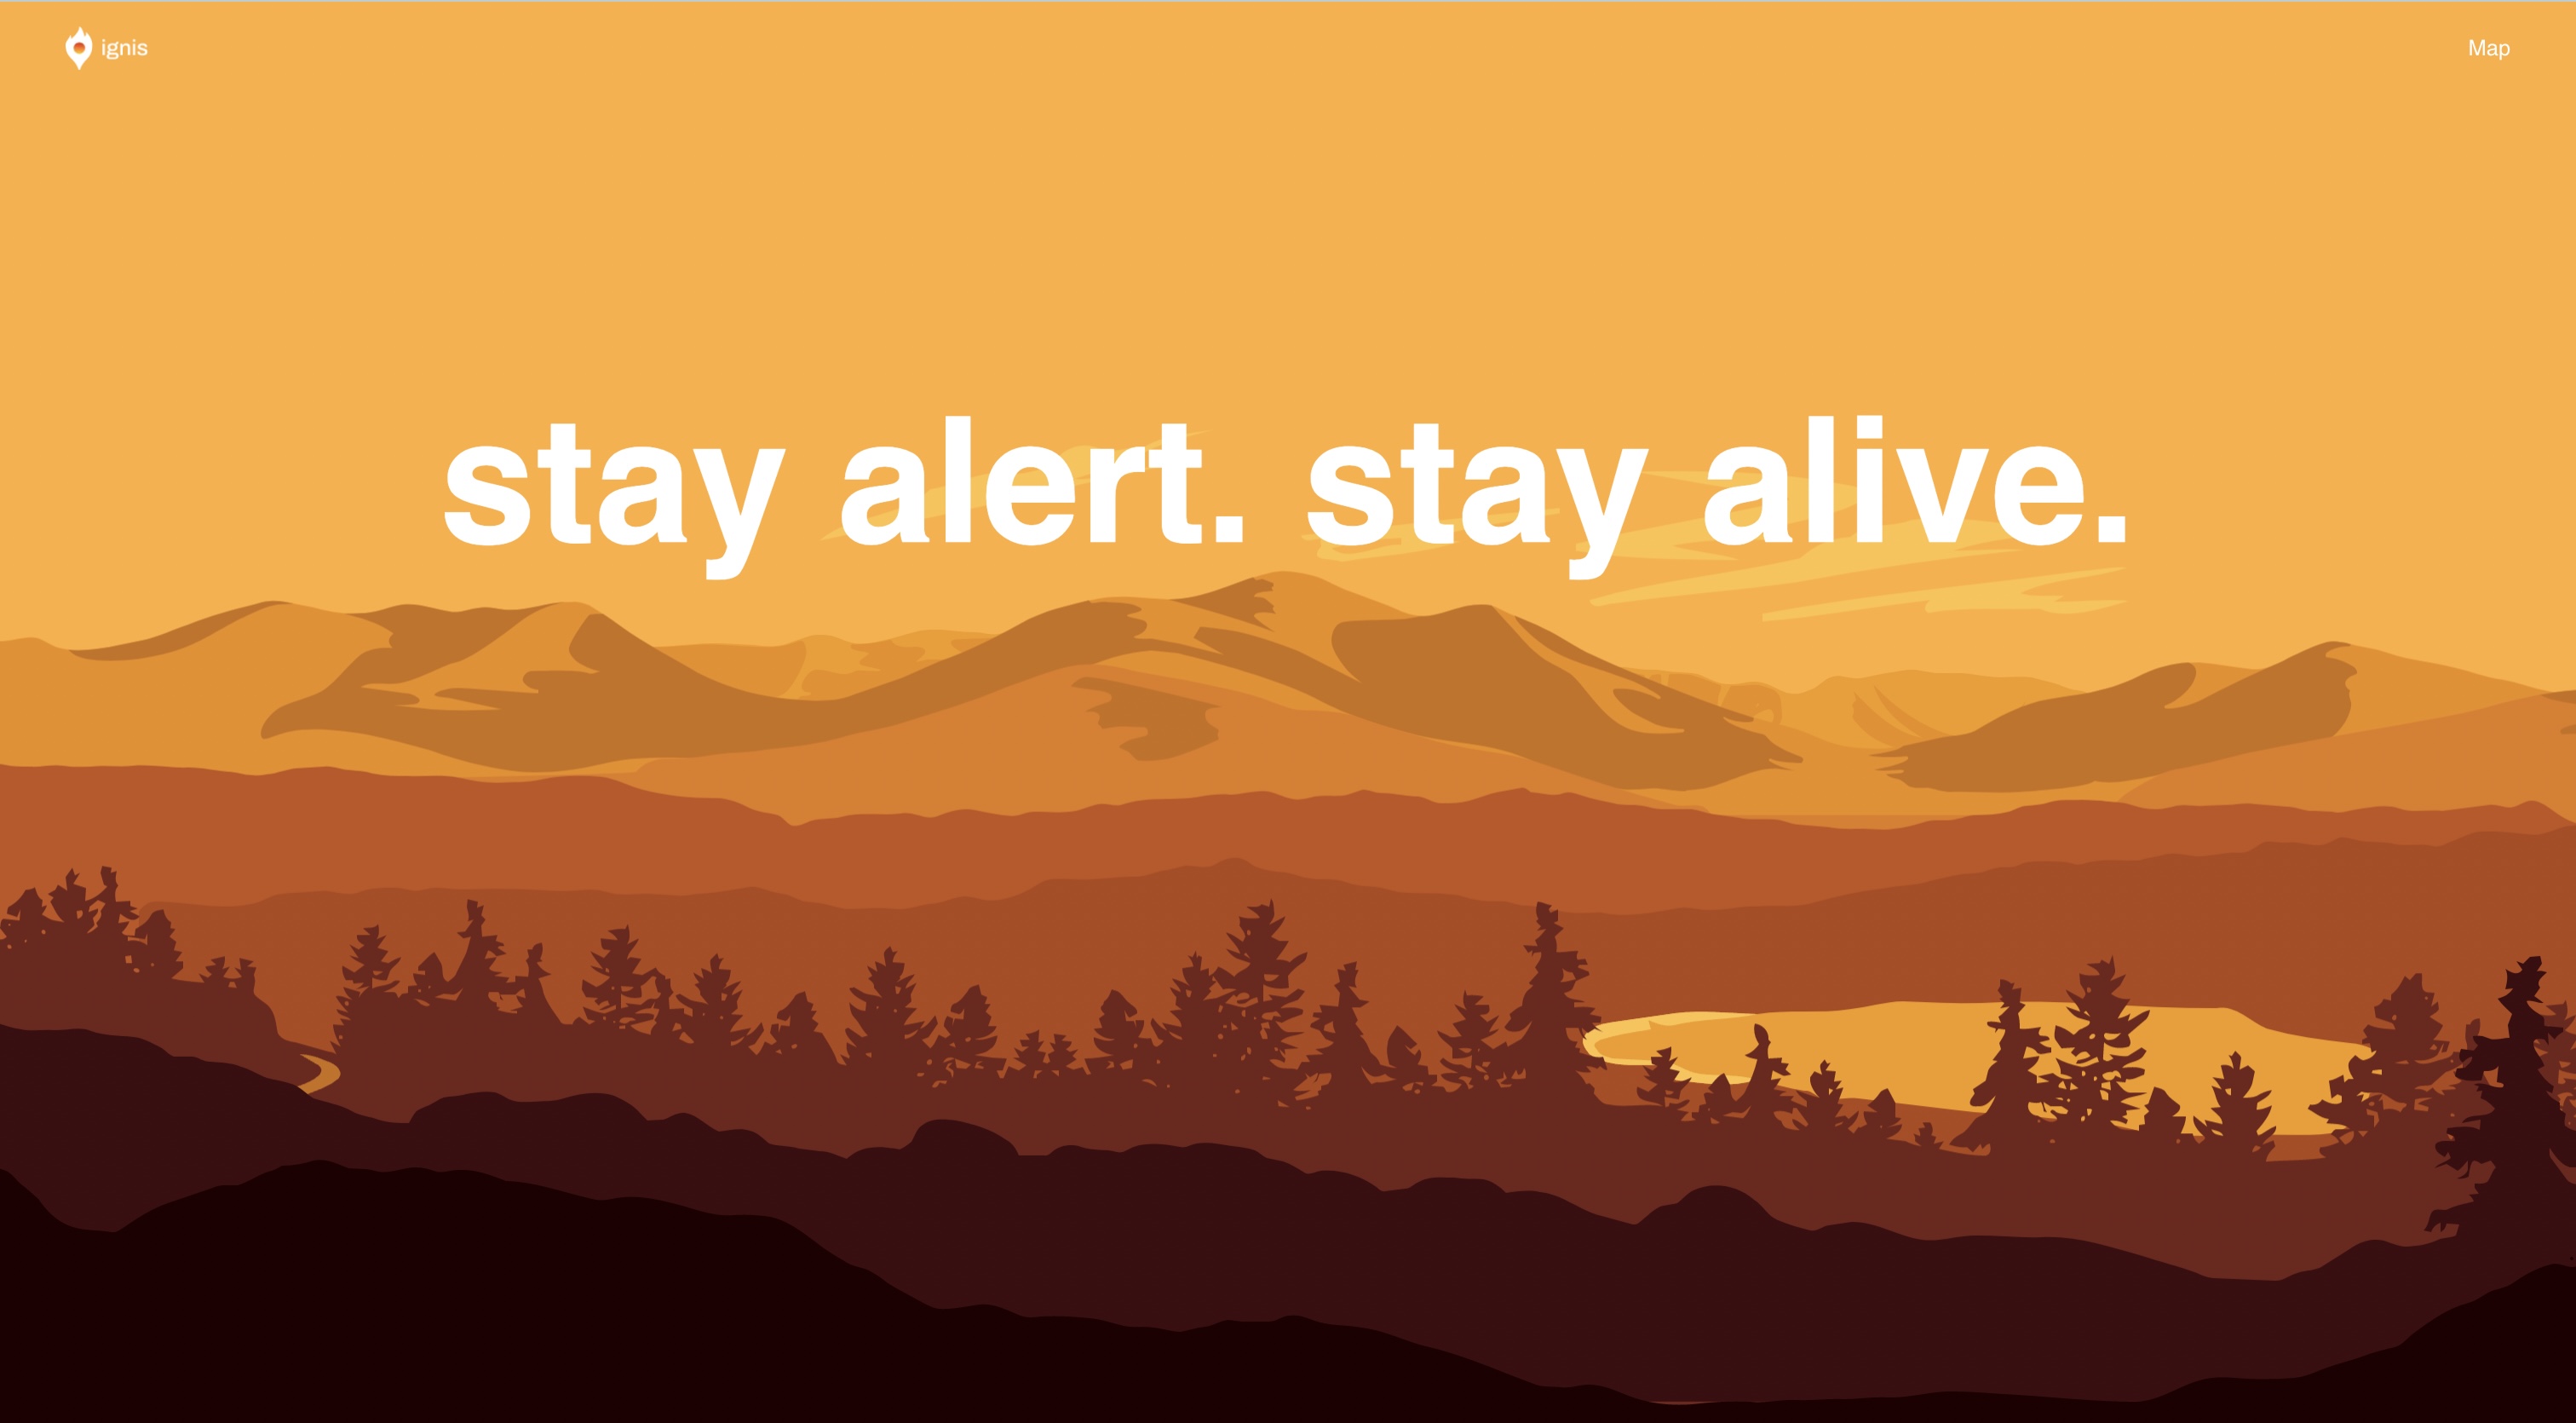
Landing Page

Map Visualizer
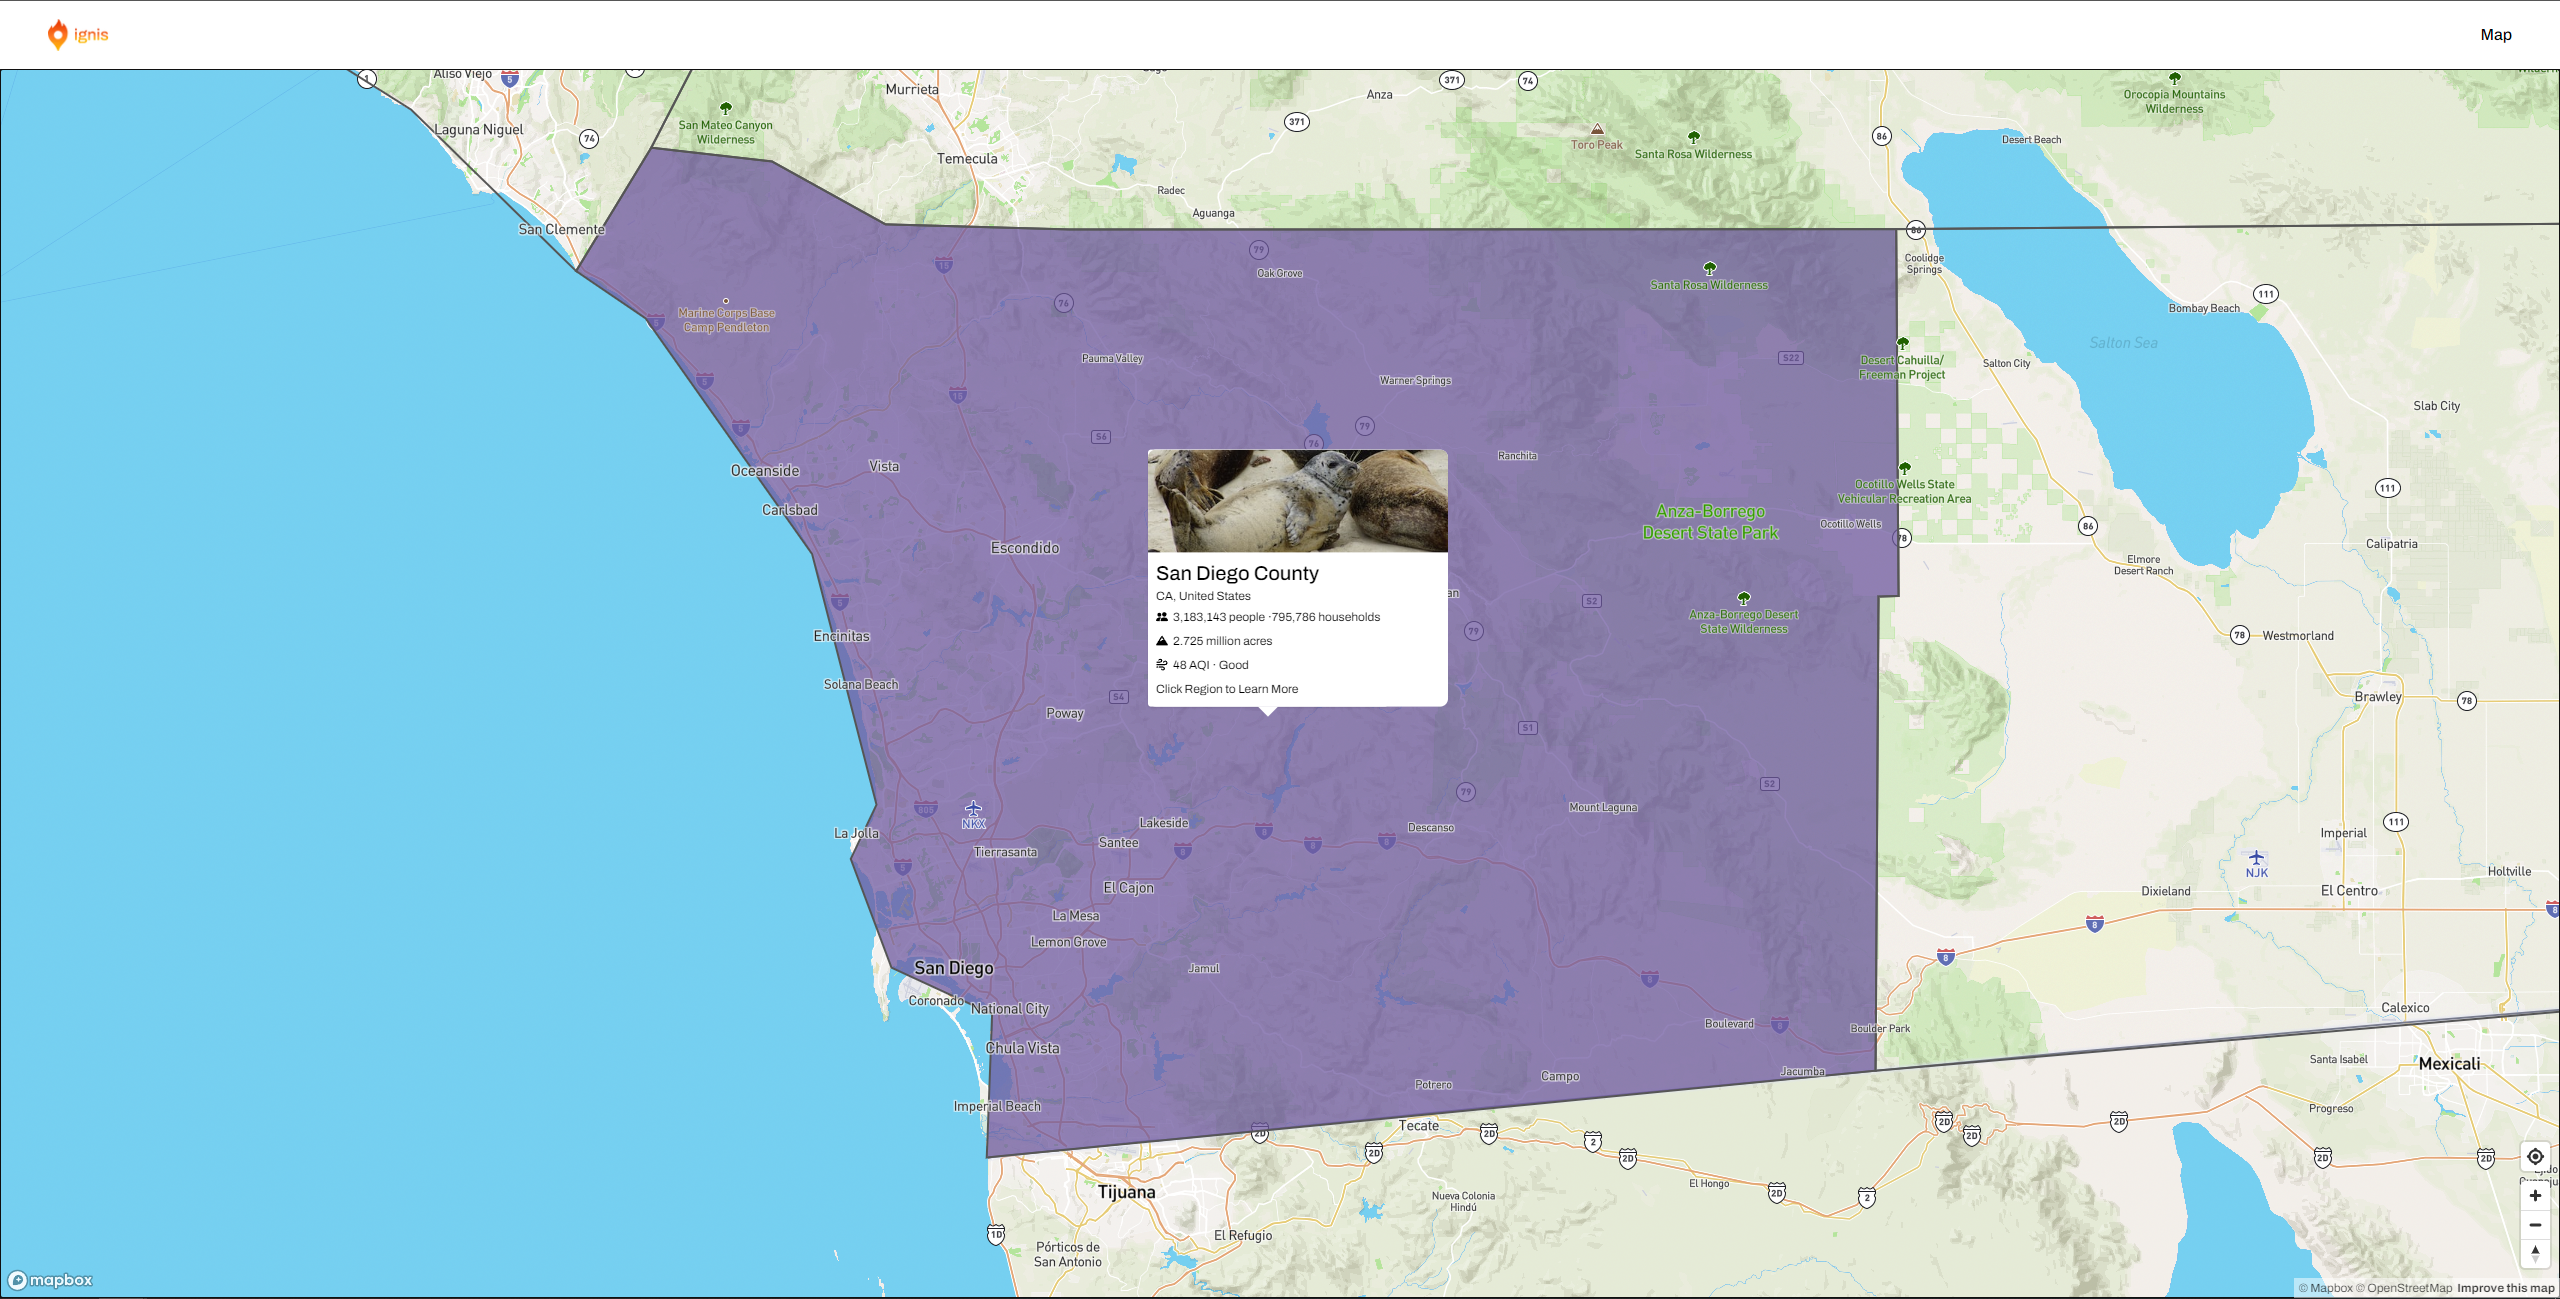

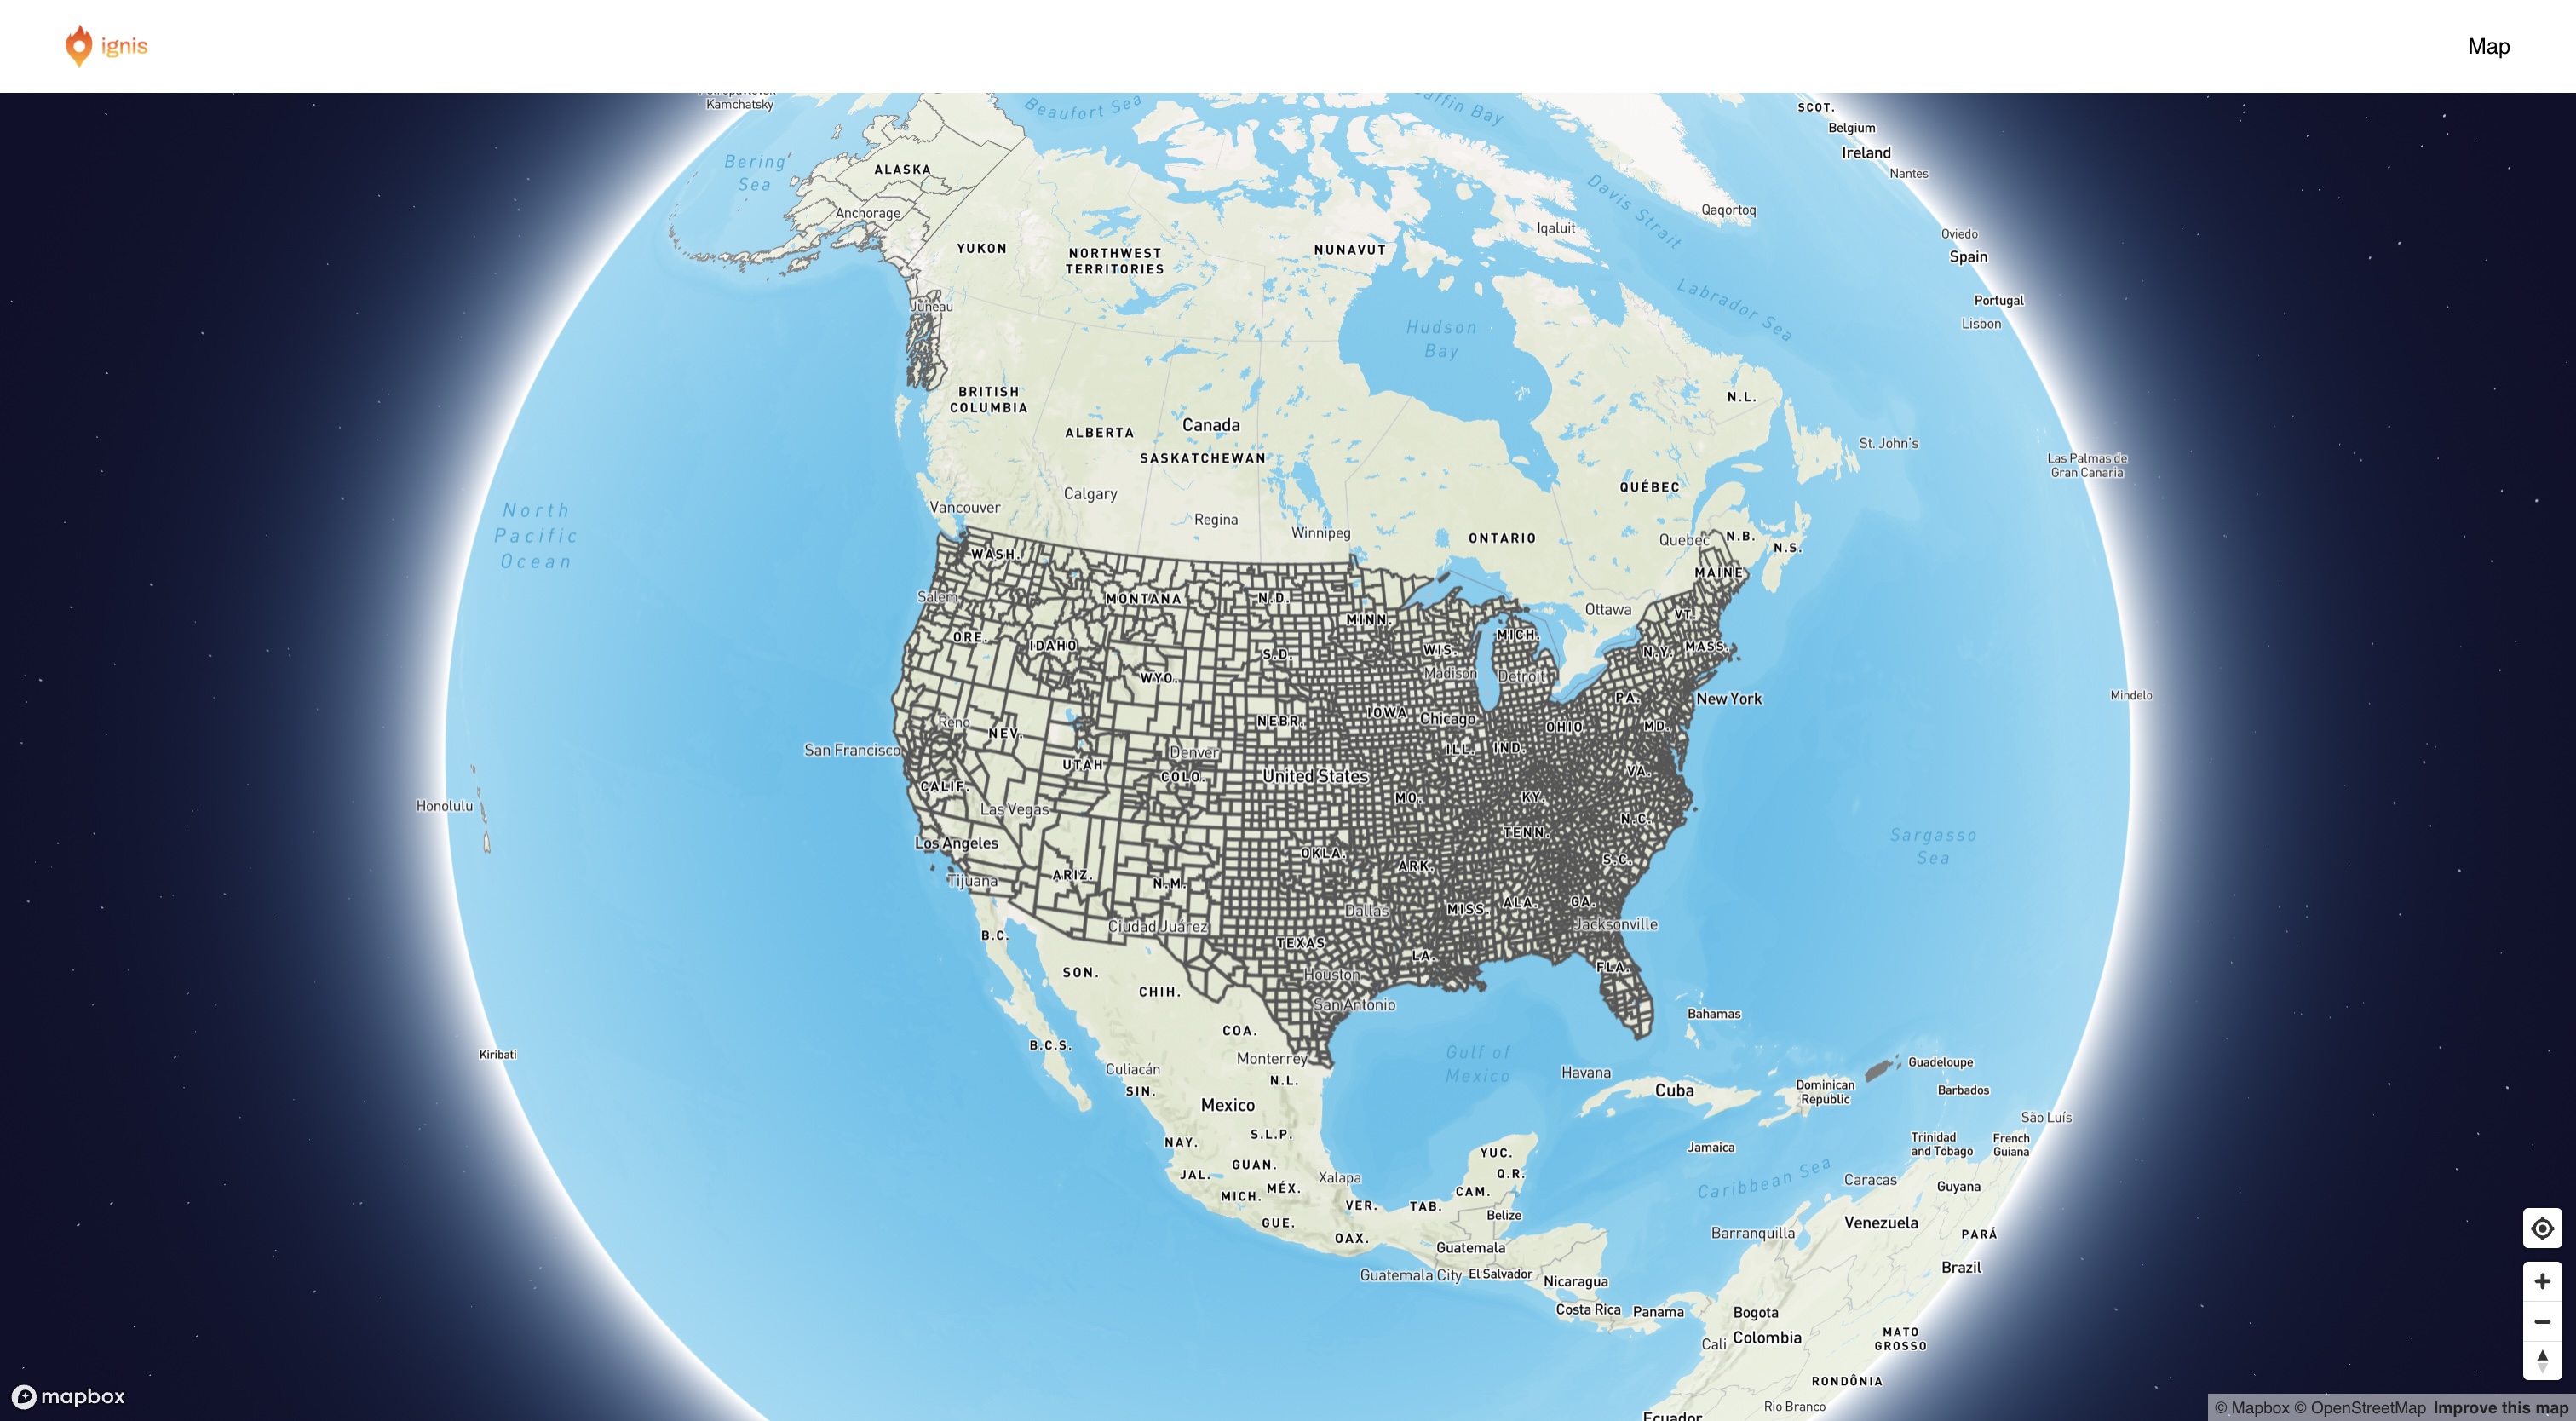
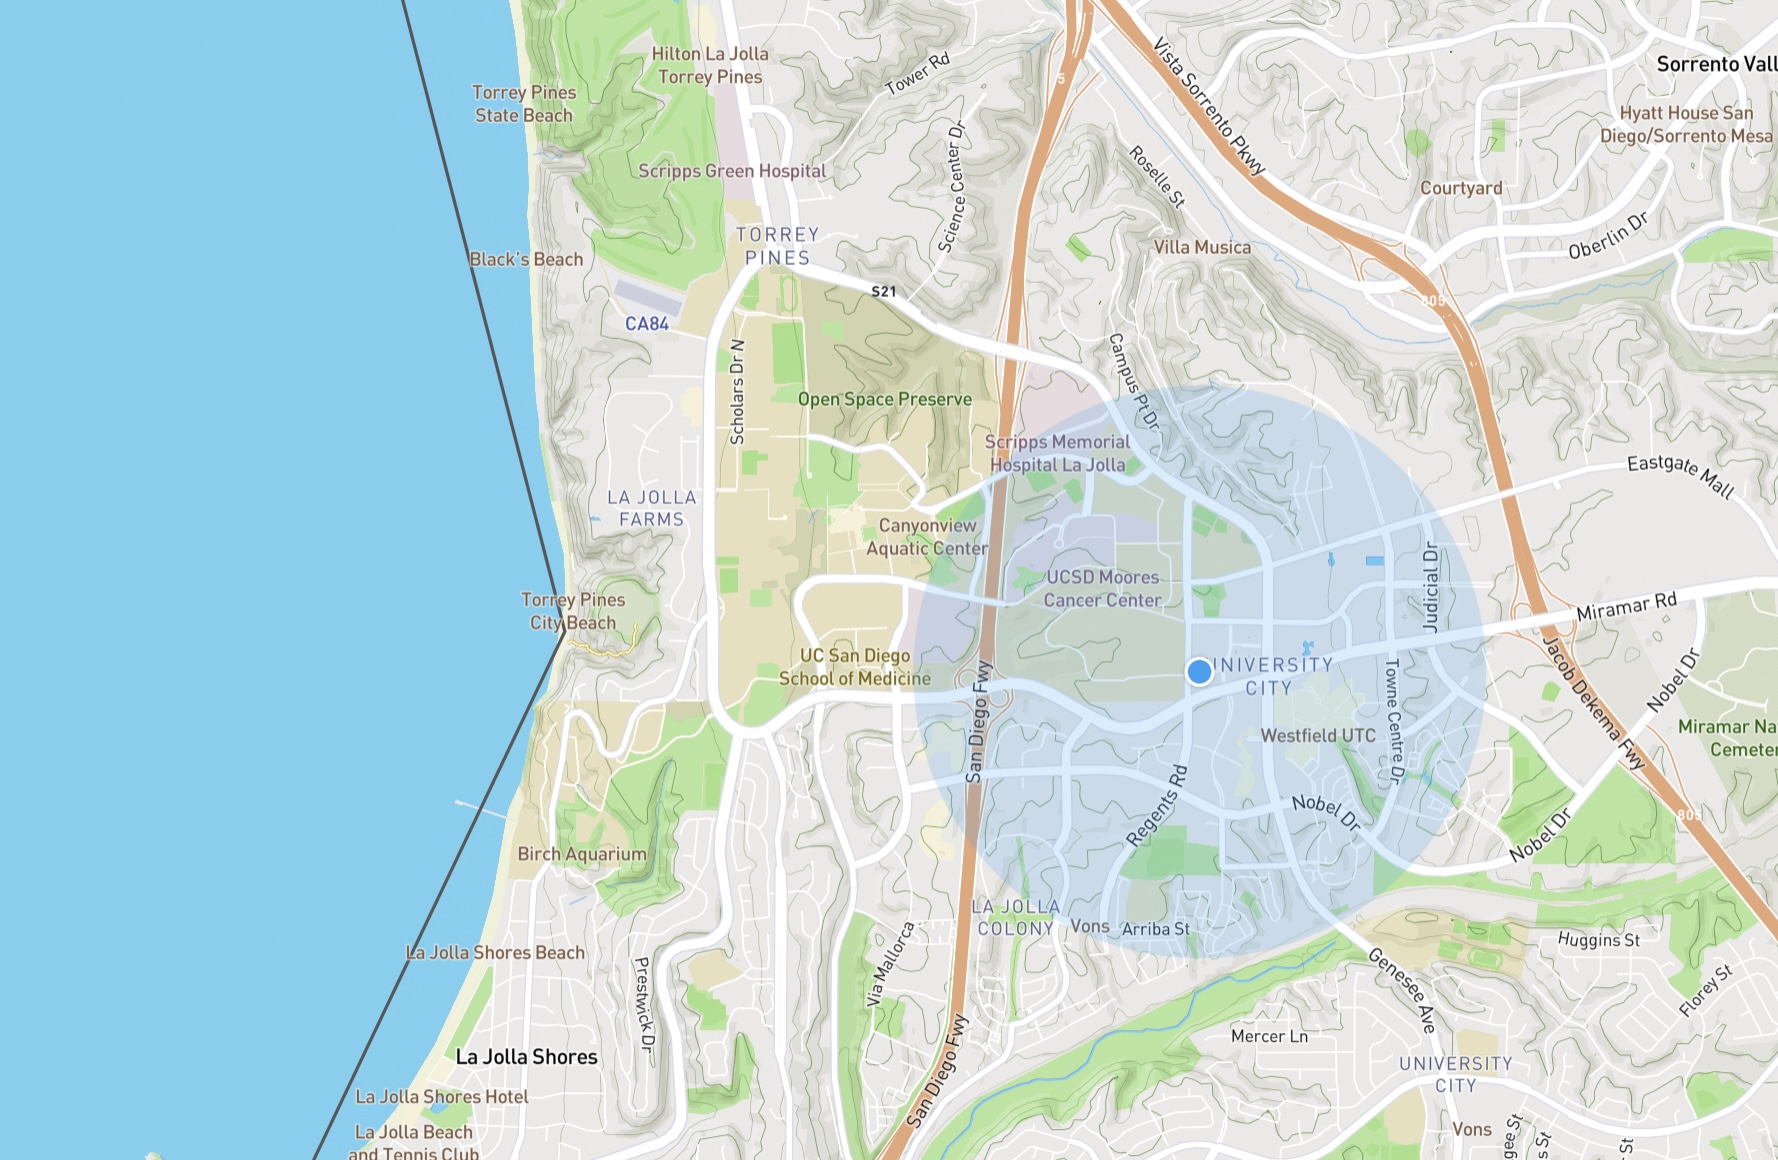
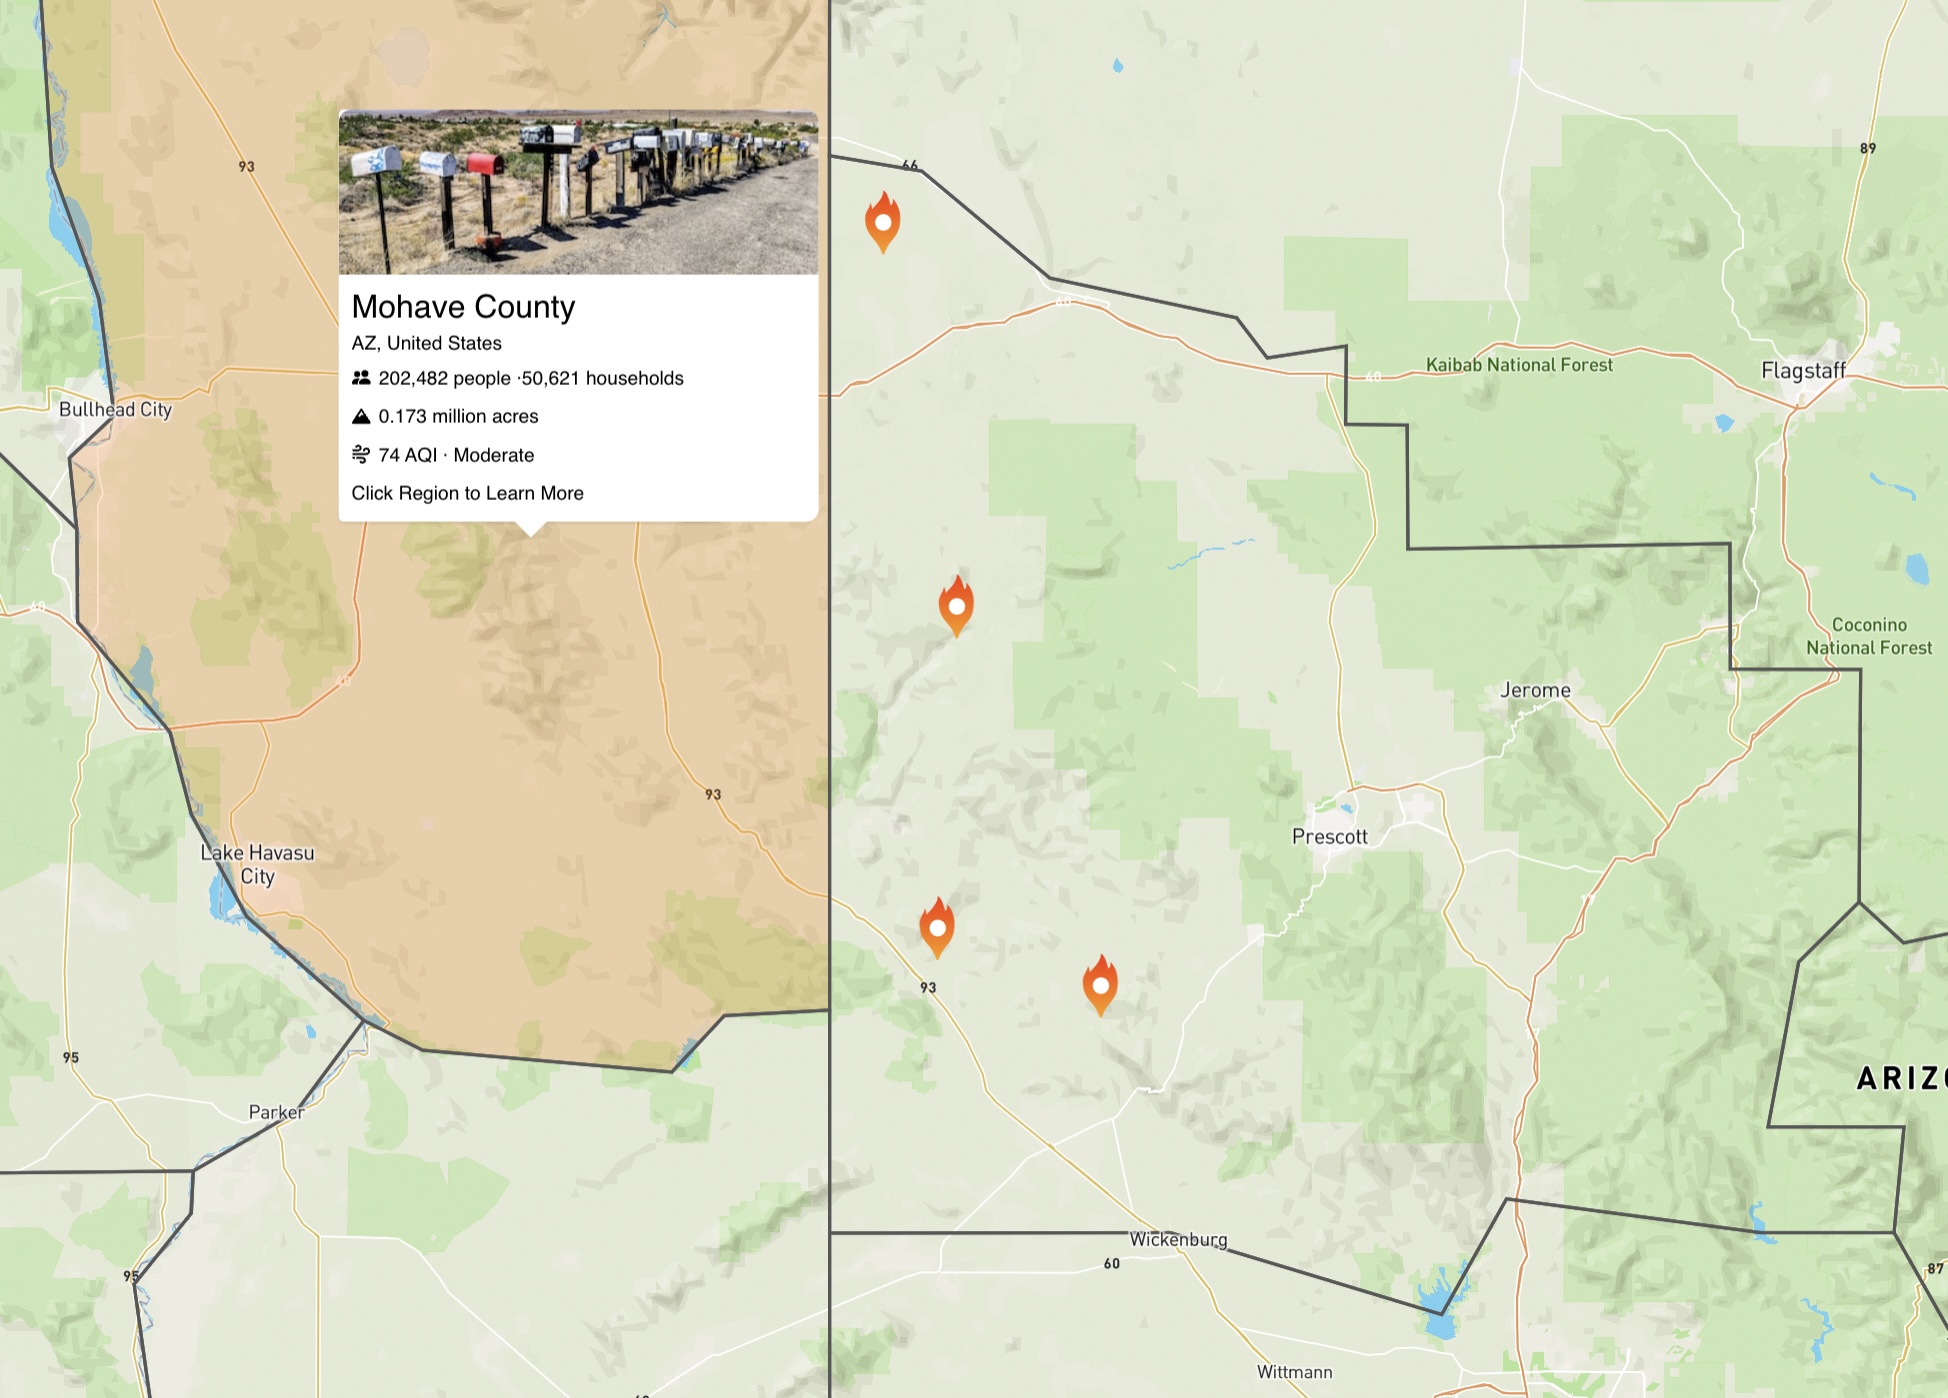
Our map views.
The biggest challenge we faced was getting the various parts of the map to work together. At first, we used Typescript and Next.js to work with a modern front-end stack, not realizing that this wasn't supported by many of the libraries we were relying on. As the library lacked types and contained breaking changes in the latest major version, it was impossible for us to display it. We solved this issue by removing TypeScript and returning to JavaScript, along with downgrading many of the libraries to balance the dependency chain. As we still wanted to use TypeScript, we ended up using a mix of these two elements in our codebase, in order to write better quality and more maintainable code! Getting the different layers to work together and display on top of one another was also tricky, especially as we had to balance multiple fill and boundary overlays of county data and hover highlighting. Then, we had to make sure only the proper hovered county was highlighted, a task we completed with the use of the proper filter. Finally, we were able to customize a popup card with real streamed API data about the relevant county to render instantly in real-time to give the user an engaging experience.
 Our tech stack
Through our backend API and serverless edge functions, we utilized many external APIs from multiple software platforms to collect the data we needed for our application into simple and unified API routes that handle complex logic with API token authorization and parameters and mapping inconsistent formats to a streamlined geoJSON structure for our Mapbox overlays.
In just a short two day hackathon, we were able to showcase the following features into our project.
- An immersive landing page experience
- Informative and captivating statistics
- Interactive map visualizations of the entire globe
- State and country highlightable selection
- Live data on population, air quality index, acreage, and predicted fire risk.
- Live location tracking of fires in given regions.
This hackathon was a great experience to use dozens of cutting-edge technologies on a powerful product and collaborate as a team in person!
For our two first-time hackers, they both worked on an incredible project for their portfolio while learning about the enthusiasm and hacking spirit. They had a chance to fully immerse themselves on this project, working tirelessly during the two days to achieve something truly special.
For our experienced hackers, they had a chance to provide mentorship to others who are just entering the field and work together to each contribute their unique skillset. They continuously challenge themselves to step out of their comfort zone with new technologies while writing high quality code to structure large-scale projects that have a real impact.
While we were ideating this project, we thought of countless ways to make this application more powerful for the users it served and continuously wanted to get more out of the project. Some of our future goals include
- Predictive calendars displaying wildfire data years into the future based on historical temperature and wildfire data along with recent trends on climate change.
- Heatmap overlays with timeline scrollbars to view temperatures across the globe during different times of the year.
- 3d visualizations of affected areas by wildfire including wind conditions.