Single-Cell ENhancer Target gene mapping using multimodal data with ATAC + RNA
(beta version)
The manuscript will soon appear at medRxiv! (Sakaue et al. "Tissue-specific enhancer-gene maps from multimodal single-cell data identify causal disease alleles")
SCENT uses single-cell multimodal data (e.g., 10X Multiome RNA/ATAC) and links ATAC-seq peaks (putative enhancers) to their target genes by modeling association between chromatin accessibility and gene expression across individual single cells.
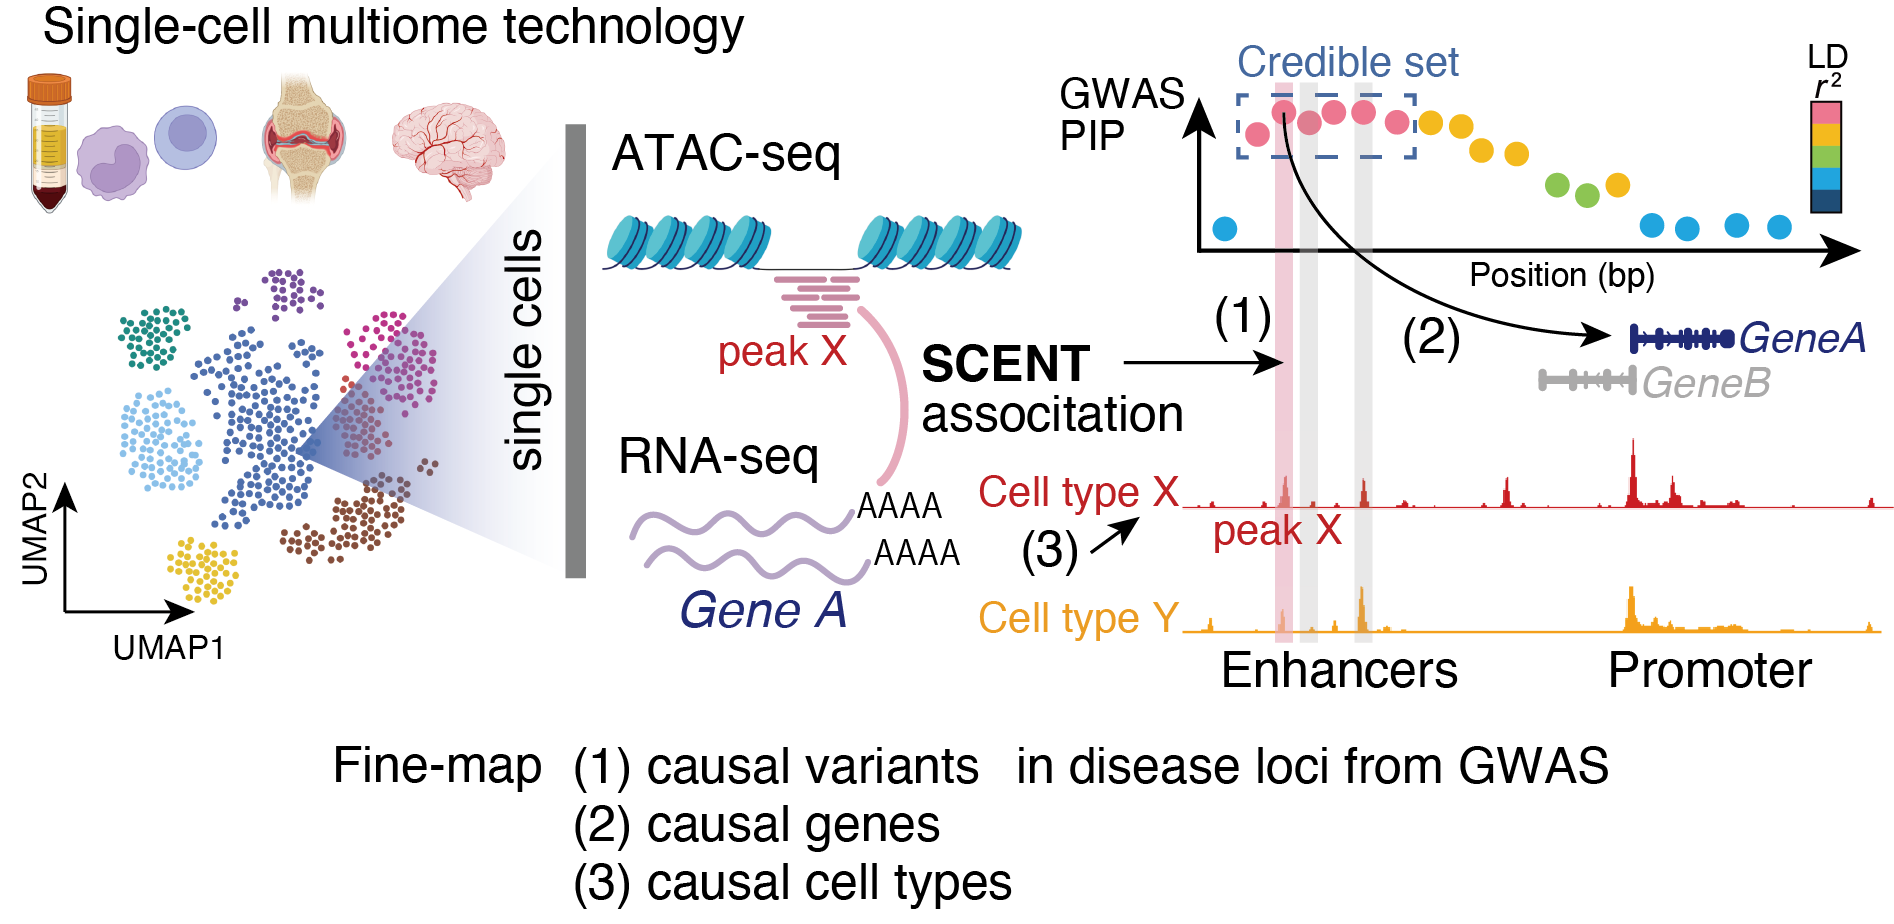
We use Poisson regression to associate gene expression (raw) count and (binarized) peak accessibility, and estimate errors in coefficients by bootstrapping framework to control for type I error.
You can install the development version of SCENT from GitHub with:
# install.packages("devtools")
devtools::install_github("immunogenomics/SCENT")The SCENT package will automatically install CRAN R packages. The packages below will go into your R.
methodsdata.tablelme4stringrbootMASSMatrixparallel
The SCENT package also requires command-line tool, bedtools, for developing a list of: gene-peak pair dataframes to parallelize through.
https://github.com/arq5x/bedtools2
Vignettes are posted in this github repo to show 2 potential uses of the SCENT package.
SCENT_interactive.Rmd vignette contains an example of using the SCENT package to generate results on small sets of gene-peak associations.
In summary, the main functionality is the SCENT object construction:
library(SCENT)

SCENT_obj <- CreateSCENTObj(rna = mrna, atac = atac, meta.data = meta,
                            peak.info = gene_peak,
                            covariates = c("log(nUMI)","percent.mito","sample", "batch"),
                            celltypes = "celltype")
Followed by SCENT algorithm:
SCENT_obj <- SCENT_algorithm(object = SCENT_obj, celltype = "Tcell", ncores = 6, regr = 'poisson', bin = TRUE)The user specifies a celltype (in this case “Tcell”) for association analysis (in meta.data slot in SCENT object), ncores for the number of cores for parallelized bootstrapping, regr for the regression type (Poisson ‘poisson’ or Negative Binomial ‘negbin’ regression), and bin for whether to binarize ATAC counts (TRUE for binarization or FALSE for not).
The output of the SCENT algorithm will be contained in the field:
SCENT_obj@SCENT.resultwhich can be saved as a textfile for further downstream analysis.
Further information on Inputs and Outputs of SCENT are detailed below:
| # | Argument name (format) | Descriptions |
|---|---|---|
| 1 | rna (sparse matrix) | A gene-by-cell count matrix from multimodal RNA-seq data. This is a raw count matrix without any normalization. The row names should be the gene names used in the peak.info file. The column names are the cell names which should be the same names used in the cellcolumn of the dataframe specified for meta.data. Sparse matrix format is required. |
| 2 | atac (sparse matrix) | A peak-by-cell count matrix from multimodal ATAC-seq data. This is a raw count matrix without any normalization. The row names should be the peak names used in the peak.info file. The column names are the cell names which should be the same names used in rna and the cellcolumn of dataframe specified for meta.data. The matrix may not be binarized while it will be binarized within the function. Sparse matrix format is required. |
| 3 | meta.data (dataframe) | A meta data frame for cells (rows are cells, and cell names should be in the column named as "cell"; see below example). Additionally, this text should include covariates to use in the model. Examples include: % mitochondrial reads, log(nUMI), sample, and batch as covariates. Dataframe format is required. |
| 4 | peak.info (dataframe) | A textfile indicating which gene-peak pairs you want to test in this chunk (see below example) genes should be in the 1st column and peaks in the 2nd column. We highly recommend splitting gene-peak pairs into many chunks to increase computational efficiency (See Parallelized Jobs Info in Section 2). List(Dataframe) format which is a list of multiple data frames for parallelization is required. * |
| 5 | covariates (a vector of character) | A vector of character fields that denote the covariates listed in the meta.data. For example, a set of covariates can be: %mitochondrial reads, log_nUMI, sample, and batch. Additionally the user can specify transformations to the covariates such as log transformation on nUMI counts for direct usage in the SCENT algorithm invoking poisson glm. We recommend users to at least use log(number_of_total_RNA_UMI_count_per_cell) as the base model is Poisson regression and we do not include the offset term into the default model. |
| 6 | celltypes (character) | User specified naming of the celltype column in the meta.data file. This column should contain the names of the celltypes you want to test in this association analysis. |
* Extra Argument: The peak.info.list field can be left blank initially and a created List(Dataframe) can be constructed using the CreatePeakToGeneList function in the SCENT package. This function requires the user to specify a bed file that specifies ~500 kb windows of multiple gene loci to identify cis gene-peak pairs to test. The vignette, SCENT_parallelize.Rmd, will show steps to produce a SCENT object with a peak.info.list field that is used for parallelization in the SCENT_parallelization.R script.
The example format of peak.info argument:
> gene_peak <- read.table("/path/to/your_gene_peak_text_file.txt")
> head(gene_peak)

    V1                      V2
1 A1BG chr19-57849279-57850722
2 A1BG chr19-57888160-57889279
3 A1BG chr19-57915851-57917093
4 A1BG chr19-57934422-57935603
5 A1BG chr19-57946848-57948062
We usually only select peaks of which the center falls within 500 kb from the target gene (cis analysis). Also, while we have a function to QC peaks and genes so that they are present in at least 5% of all cells within SCENT.R, it is more efficient to only include these QCed peaks and genes in peak.info to reduce the number of tests.
The example format of meta.data argument:
meta <- readRDS(metafile)
meta$`log(nUMI)` <- log(meta$nUMI)
head(meta)

                                 cell nUMI percent.mito   sample   batch
AAACAGCCAAGGAATC-1 AAACAGCCAAGGAATC-1 8380   0.01503428 sample_1 batch_a
AAACAGCCAATCCCTT-1 AAACAGCCAATCCCTT-1 3771   0.02207505 sample_1 batch_a
AAACAGCCAATGCGCT-1 AAACAGCCAATGCGCT-1 6876   0.01435579 sample_1 batch_a
AAACAGCCACACTAAT-1 AAACAGCCACACTAAT-1 1733   0.03881841 sample_1 batch_a
AAACAGCCACCAACCG-1 AAACAGCCACCAACCG-1 5415   0.01600768 sample_1 batch_a
AAACAGCCAGGATAAC-1 AAACAGCCAGGATAAC-1 2759   0.02485340 sample_1 batch_a
                   celltype  log(nUMI)
AAACAGCCAAGGAATC-1    Tcell   9.033603
AAACAGCCAATCCCTT-1    Tcell   8.235095
AAACAGCCAATGCGCT-1    Tcell   8.835792
AAACAGCCACACTAAT-1    Tcell   7.457609
AAACAGCCACCAACCG-1    Tcell   8.596928
AAACAGCCAGGATAAC-1 Tcell 7.922624> head(SCENT_obj@SCENT.result)
gene peak beta se z p boot_basic_p
A1BG chr19-57849279-57850722 0.587060911718621 0.227961010352348 2.57526894977009 0.0100162168431262 0.0192
A1BG chr19-57888160-57889279 -0.0842330294127105 0.232845263030106 -0.3617553920425660.717534829528597 0.688
A1BG chr19-57915851-57917093 -0.00971211792633636 0.225020479431863 -0.0431610400566990.965573161660521 1
A1BG chr19-57934422-57935603 0.0136752444069743 0.249810124611214 0.05474255468331160.956343566437322 0.968Each column indicates ...
| Column | Descriptions |
|---|---|
| gene | The gene(-peak) pair in each test statistics |
| peak | The (gene-)peak pair in each test statistics |
| beta | The regression coefficient from primary Poisson regression |
| se | The standard error from primary Poisson regression |
| z | The Z score from primary Poisson regression |
| p | The raw p value from primary Poisson regression |
| boot_basic_p | The bootstrap p value calculated from bootstrapping analyses |
SCENT_parallelization.R is the example code necessary for running parallelized SCENT jobs.
This code needs a SCENT_Object.rds file that contains a list of gene-peak pairs.
To generate this object please follow the SCENT_parallelize.Rmd vignette file.
The corresponding bash script parallelizedSCENT.sh contains a parallelization scheme that is
dependent on the amount of gene-peak pair batches that is user defined (for context please refer to the
SCENT_parallelize.Rmd vignette). The main part of the bash script contains the line:
Rscript SCENT_parallelization.R $LSB_JOBINDEX ${num_cores} ${file_SCENT_obj} ${celltype} ${regr} ${bin} ${output_dir}Arguments in the bash file are user specified as follows:
| # | Argument Name | Descriptions |
|---|---|---|
| 1 | LSB_JOBINDEX | jobarray index specified by BSUB -J SCENT[1-100] |
| 2 | num_cores | number of cores (ex. 6) to parallelize to the SCENT algorithm |
| 3 | file_SCENT_obj | SCENT object that contains atac_matrix, rna_matrix, metafile, peak_gene_list, etc. To run the SCENT algorithm |
| 4 | celltype | User specified celltype (ex. "Tcells") to run the SCENT algorithm |
| 5 | regr | User specified regression type (ex. "poisson") to run SCENT algorithm |
| 6 | bin | User specified choice to binarize ATAC counts (ex. TRUE) |
| 7 | output_dir | User specified directory to output the SCENT results to aggregate once completed |
Saori Sakaue ssakaue@broadinstitute.org