The Panodata Map Panel is an enhanced and maintained friendly fork of the original Grafana Worldmap Panel. We will be happy to receive feedback and contributions from the community at the upstream discussion topic and on GitHub. You are also encouraged to follow the development in more detail at first steps, Developing Grafana Worldmap NG and by reading the changelog.
The map panel displays a tile map of the world that can be overlaid with circles representing data points from a query. It can be used with time series metrics, with geohash data from Elasticsearch or data in the Table format.
This plugin needs two sources of data:
- a location (latitude and longitude)
- data that has a link to a location
The data comes from a database query: Prometheus, InfluxDB, Graphite, Elasticsearch, MySQL etc. It can be in the Time Series format or in the Table format.
If it is in the Time Series format then the metric name needs to match a key from a list of locations. That key is usually a country code or city name. The list of locations can come from a file or an HTTP endpoint.
The list of locations can be provided in several ways:
- json files with locations and their coordinates (the plugin includes list for countries and US states)
- json endpoints that return a list of locations and their coordinates
Time Series data contains a timestamp, a metric name and a numeric value. In other words, a typical query for a time series database. Here is some time series data from Graphite:
[
  {"target": "SE", "datapoints": [[183255.0, 1529755200]]},
  {"target": "US", "datapoints": [[192224.0, 1529755200]]}
]
Location data should be in the JSON format and should be an array of JSON objects with four properties:
[
  {
    "key": "SE",
    "latitude": 60.128161,
    "longitude": 18.643501,
    "name": "Sweden"
  },
  {
    "key": "US",
    "latitude": 37.09024,
    "longitude": -95.712891,
    "name": "United States"
  }
]
The metric name (target in the example data) will be matched with a key field from the location data. With this example data there will be two circles drawn on the map, one for Sweden and one for the United States with values 183255 and 192224.
If the data is in the Table format then it should have a column that is a geohash or two columns that contain the latitude and longitude (together with the columns for the data).
Table data is tabular data with columns and rows. Here is an example of Table data from InfluxDB:
"series": [
  {
    "name": "logins.count",
    "tags": {
      "geohash": "9wvfgzurfzb"
    },
    "columns": [
      "time",
      "metric"
    ],
    "values": [
      [
        1529762933815,
        75.654324173059
      ]
    ]
  }
]
This query contains both data (the value 75.654324173059) and a location (the geohash 9wvfgzurfzb which is in Colorado). So using these, one circle will be drawn in Colorado, USA with the value 75.654324173059.
Supported Databases:
- Graphite
- InfluxDB
- OpenTSDB
- Prometheus
- MySQL
- Postgres
- MSSQL
- Elasticsearch
The following location files are included in the plugin:
- Countries (2 letter codes)
- Countries (3 letter codes)
- US states
Alternatively, you can provide your own location lists by using:
- A JSON endpoint that returns a list of locations
- A JSONP endpoint that returns a list of locations
This works by matching country codes (like US or GB or FR) or US state codes (TX or NY) to a metric name. If a metric name matches a country in the list of countries then a circle will be drawn at that location.
If you want to match to other data than countries or states, then you will have to provide custom location data. The current way to do that is via a JSON endpoint that returns a json file with location data (See Map Data Options)
The size of the circle depends on the value of the matched metric. Circle size is relative e.g. if you have 3 countries with values 1, 2 and 3 or 100, 200 and 300 then you will get one small circle, one medium circle and one large circle.
Here are some examples of Time Series Queries
Use the aliasByNode function to point to the field containing the country code. See the image below for an example of a graphite query.

Example dashboard with Graphite queries on the Grafana play site.
The Group By clause should be the country code and an alias is needed too. The alias should be in the form $tag_<field name>.

Use a Group By clause on the field containing the country code and a Then by clause with Date Histogram by @timestamp (or corresponding date field).

On the editor tab, choose either the countries or states option.

Using a JSON endpoint to return a custom list of locations:

The endpoint used here is for the demo version of worldPing - https://worldpingdemo.grafana.net/api/plugin-proxy/raintank-worldping-app/api/v2/probes/locations. If you have your own endpoint defined it must be reachable from the client side, as it is approached by client's browser.
Using a JSONP endpoint (if you need to wrap the JSON to get around CORS problems):

For some details on troubleshooting JSON/JSONP check #47.
Supported Databases:
- ElasticSearch
The Geo-point data type with geohash indexing in Elasticsearch can also be used as a datasource. Grafana has a new bucket aggregate for Elasticsearch queries - Geo Hash Grid that allows grouping of coordinates. The Geo Hash Grid has a precision option where 1 is the highest level and 7 is the lowest.

Three fields need to be provided by the ElasticSearch query:
- A metric. This is free text and should match the aggregation used (Count, Average, Sum, Unique Count etc.)
- Location Name (optional - geohash value will be shown if not chosen)
- geo_point field that provides the geohash value.

Supported Databases:
- InfluxDB
- Elasticsearch
- MySQL, Postgres, MSSQL
- Any database that can return data in Table Format
If a datasource can return Table Data then on the Metrics tab in Grafana choose the FORMAT AS Table option.
Similar to the Elasticsearch query above, 3 fields are expected (2 of them are mandatory)
- A metric field. This is used to give the circle a value and determines how large the circle is.
- A geohash field. This is used to calculate where the circle should be drawn.
- an optional location name field (shown in the mouse over). Used to label each circle on the map. If it is empty then the geohash value is used as the label.
The field mappings have to be specified on the "settings" tab.

The Table Data format also works with two columns for latitude and longitude instead of a geohash column.
- A metric field. This is used to give the circle a value and determines how large the circle is.
- Latitude/Longitude Fields. These are used to calculate where the circle should be drawn.
- an optional location name field (shown in the mouse over). Used to label each circle on the map. If it is empty then the geohash value is used as the label.
Supported Databases:
- Warp 10 via grafana-warp10-datasource plugin
It supports any datasource capable of generating a JSON response with a custom list of locations (the same format that for the JSON endpoint).
There are four ways to provide data to this plugin:
- countries: This is a list of all the countries in the world. It works by matching a country code (US, FR, AU) to a node alias in a time series query.
- states: Similar to countries but for the states in USA e.g. CA for California
- geohash: An ElasticSearch query that returns geohashes.
- json: A json endpoint that returns custom json. Examples of the format are the countries data used in first option or this list of cities.
- jsonp: A jsonp endpoint that returns custom json wrapped as jsonp. Use this if you are having problems with CORS.
- table: This expects the metric query to return data points with a field named geohash or two fields/columns named
latitudeandlongitude. This field should contain a string in the geohash form. For example: London -> "gcpvh3zgu992".
If you chose countries or table as the source of the location data then you can choose an aggregation here: avg, total etc.
For Graphite, be aware that the default value for Max Data Points is 1. This is to aggregate data points per country to one value in the most accurate way. This will by default, consolidate by average. To change the consolidation, use the consolidateBy function like so:

Or just remove the 1 from the Max Data Point field and use the consolidation functions in Map Data Options (though depending on the timerange and amount of data points, this will be usually less accurate due to Graphite consolidation).

Three fields need to be provided by the ElasticSearch query. They are text fields and should be the field names from the query under the Metrics tab.
- The Metric in Elasticsearch is one of
Count,Average,Sumetc. - Location Name is the field that gives the circle a name. If it is blank, then the geohash value is shown in the popover instead of the location.
- geo_point is the GeoHashGrid field that provides the geohash value.
Center
This settings configures the default center of the map. There are 5 centers to choose from or you can choose a custom center or last GeoHash center..For a custom center there are two fields: latitude and longitude. Examples of values are 37.09024, -95.712891 for the center of the US or 55.378051, -3.435973 for Great Britain. Last GeoHash center will centered the map on the last GeoHash received from the data.
Initial Zoom
The initial zoom factor for the map. This is a value between 1 and 18 where 1 is the most zoomed out.
Min Circle Size
This is minimum size for a circle in pixels.
Max Circle Size
This is the maximum size for a circle in pixels. Depending on the zoom level you might want a larger or smaller max circle size to avoid overlapping.
Unit
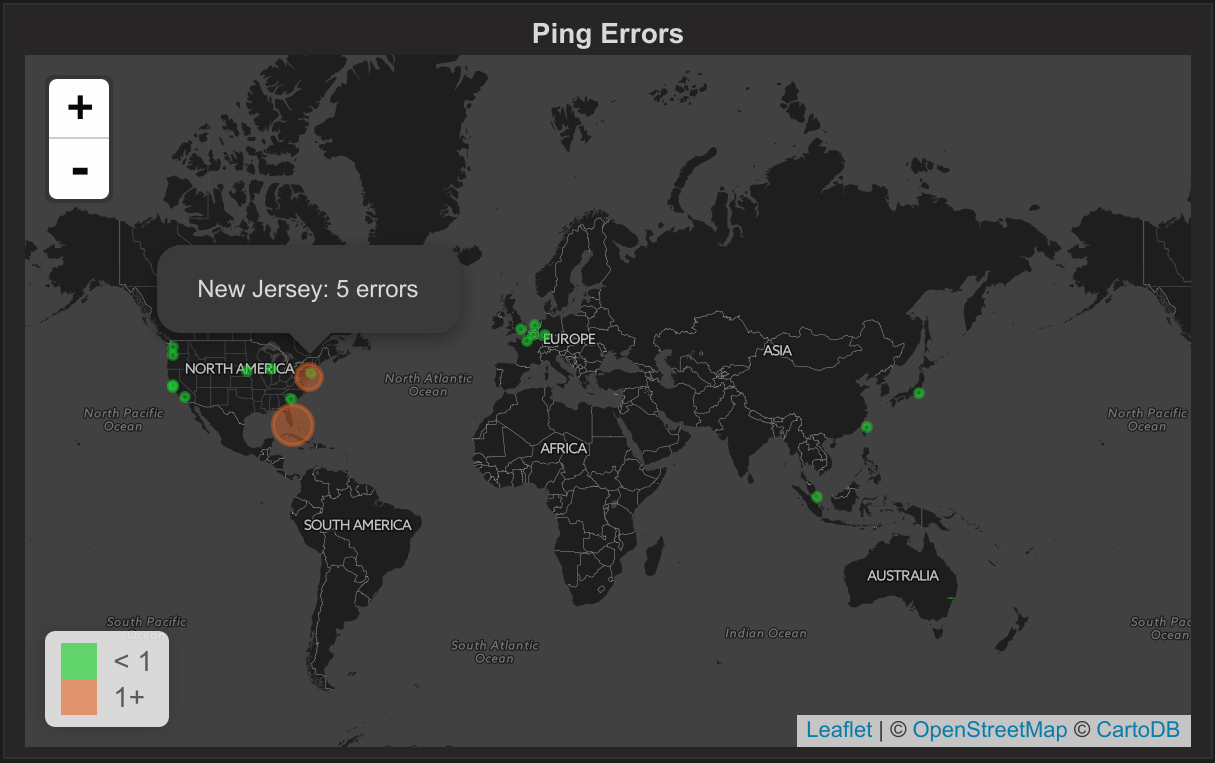
The Unit is shown in the popover when you hover over a circle. There are two fields the singular form and the plural form. E.g. visit/visits or error/errors
Show Legend
Shows/hide the legend on the bottom left that shows the threshold ranges and their associated colors.
Thresholds control the color of the circles.
If one value is specified then two colors are used. For example, if the threshold is set to 10 then values under 10 get the first color and values that are 10 or more get the second color.
The threshold field also accepts 2 or more comma-separated values. For example, if you have 2 values that represents 3 ranges that correspond to the three colors. For example: if the thresholds are 70, 90 then the first color represents < 70, the second color represents between 70 and 90 and the third color represents > 90.
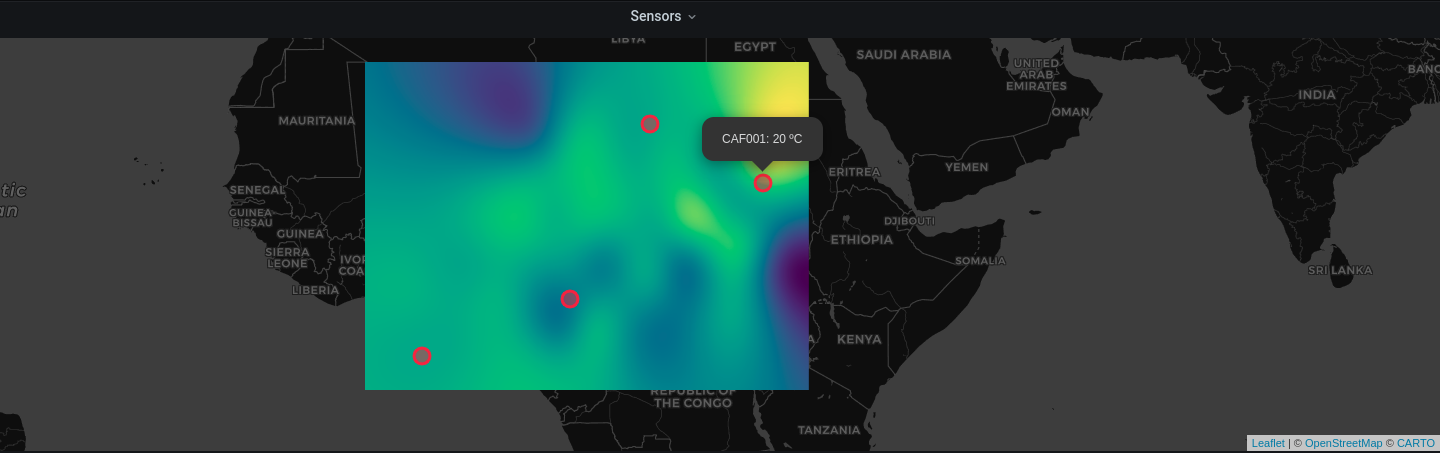
Optionally, you can show an image over the base map (but below the data points). This could be useful, for example, to show a more detailed/up-to-date image of the area of interest, in case the map provider only has old or low-resolution images. See below for an example of displaying interpolated sensor data (for example, temperatures in a field while only knowing the temperatures at a few sensors).
Enable overlay
Show/hide the overlay.
Auto reload overlay
By default, the overlay image is fetched once, on page load, and never updated. If the overlay image is updated regularly (say, the overlay is generated on another application and then served on a fixed URL), it may be desirable to fetch the image when the dashboard is refreshed. This switch enables it.
If the overlay image is fixed (e. g., an orthomosaic of the area, taken with a drone), leave this option disabled, as it would cause an additional request on each dashboard reload.
Overlay URL
The URL where the image is available. Please notice that only URLs can be used (no local files!)
Overlay opacity
The image overlay's opacity can be controlled (0=completely transparent, 1=completely opaque)
Latitude and longitude ranges
Specify the limits of the image in the map. Enter the minimum and maximum latitude, and the minimum and maximum longitude, separated by a comma. These numbers specify the extent of the overlay.
The latest changes can be found here: CHANGELOG.md