Code for Kluger Lab project to classify breast cancer tissue into HER2+ or HER2- using CNNs. (Work in progress)
- Python 3.4 or higher
- Numpy
- PIL
- matplotlib
- tensorflow
- tensorflow-hub
- OpenSlide
Openslide can be installed by following the instructions at https://openslide.org/download/. All other libraries can be installed via pip.
Assumptions: The library assumes that the user has available a collection of whole-slide images (WSIs) whose region of interests have been annotated using the open source program QuPath.
Usage: Starting from QuPath, the user should first open their qpproj file encompassing their annotations and then
run the extract_polygons.groovy script from QuPath's automation interface. Doing so will generate a folder
for each slide containing CSV files with the coordinates of that slide's annotations.
Usage: python3 construct_training_dataset
Description: Creates a dataset of non-overlapping patches from the slides.
Relevant Constants:
* `SLIDE_FILE_DIRECTORY`
* `SLIDE_FILE_EXTENSION`
* `PATCH_OUTPUT_DIRECTORY`
* `LABEL_FILE_PATH`
* `ANNOTATION_CSV_DIRECTORY`
Usage: python3 train_network_kfold.py. Outputs trained model files to MODEL_FILE_FOLDER found in constants.py.
Description: Retrains the final layer of a pre-trained model (ex. Inceptionv3, ResNet50) to classify patches of whole-slide images. To better evaluate the robustness of the model, the script will train k models, each with a different train-test split. Train/test data split are determined as in k-fold cross validation. A good starting point is k = 5 giving a train/test ratio of 80%/20%.
Relevant Constants:
* `NUM_FOLDS`
* `TFHUB_MODULE`
* `HOW_MANY_TRAINNG_STEPS`
* `RANDOM_CROP`
* `RANDOM_SCALE`
* `RANDOM_BRIGHTNESS`
* `FLIP_LEFT_RIGHT`
* `MODEL_FILE_FOLDER`
* `INPUT_LAYER`
* `OUTPUT_LAYER`
* `TEST_SLIDE_FOLDER`
* `TEST_SLIDE_LIST`
Usage: python3 create_visualization_helper_files.py
Description: Evaluates model on testing data and saves results in helper files used in the visualization scripts (below).
Relevant Constants:
* `TEST_SLIDE_FOLDER`
* `MODEL_FILE_FOLDER`
* `LABEL_FILE_PATH`
* `INPUT_LAYER`
* `OUTPUT_LAYER`
* `HISTOGRAM_FOLDER`
* `FOLD_VOTE_CONTAINER_LISTS`
* `PATCH_CONFIDENCE_FOLD_SUBFOLDER`
* `CONFIDENCE_CONTAINER_LIST`
* `PATCH_NAME_TO_CONFIDENCE_MAP`
* `POS_SLIDE_CONFIDENCE_LISTS`
* `NEG_SLIDE_CONFIDENCE_LISTS`
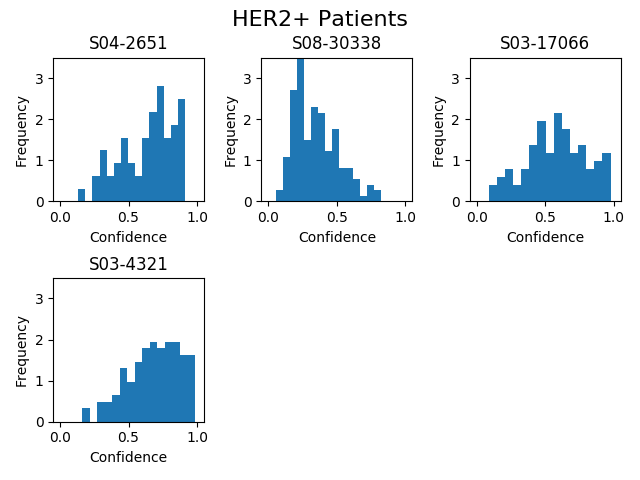
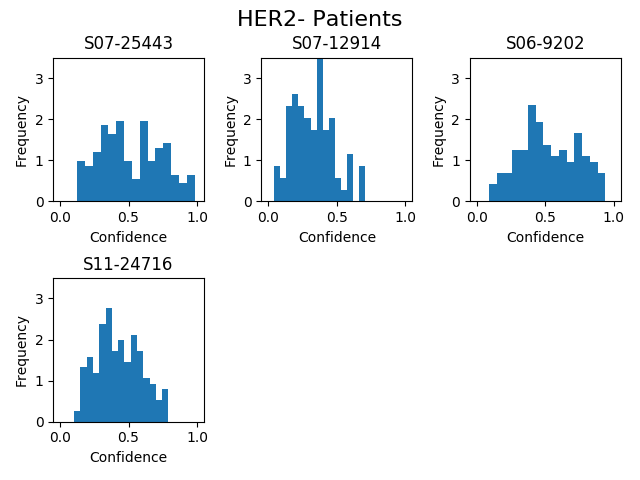
Usage: python3 draw_histograms.py. Outputs PNG files in the directory HISTOGRAM_FOLDER as specified in constants.py.
Description: Display the relative frequencies of patches for each test patient classified as positive by the network for a given fold.
Relevant Constants:
* `POS_SLIDE_CONFIDENCE_LISTS`
* `NEG_SLIDE_CONFIDENCE_LISTS`
* `HISTOGRAM_FOLDER`
* `HISTOGRAM_SUBFOLDER`
Example:
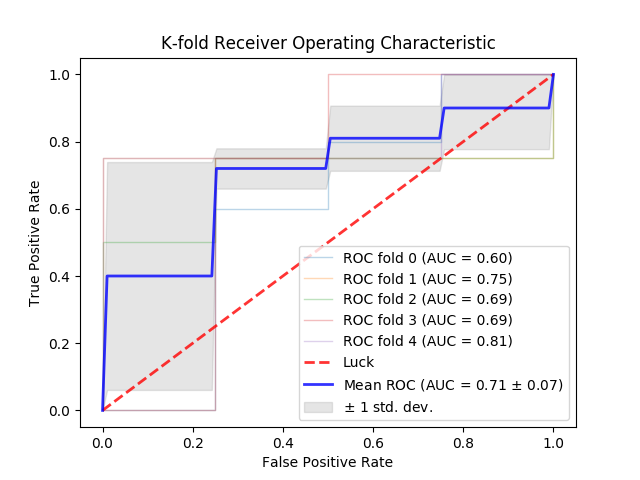
Usage: python3 draw_kfold_roc_curve.py. Outputs PNG file in the directory from which the script is run.
Description: Computes ROC curves for each of the k trained networks. Displays these as well as averages them into a single curve with accompanying error bars.
Relevant Constants:
* `FOLD_VOTE_CONTAINER_LISTS_PATH`
Example:
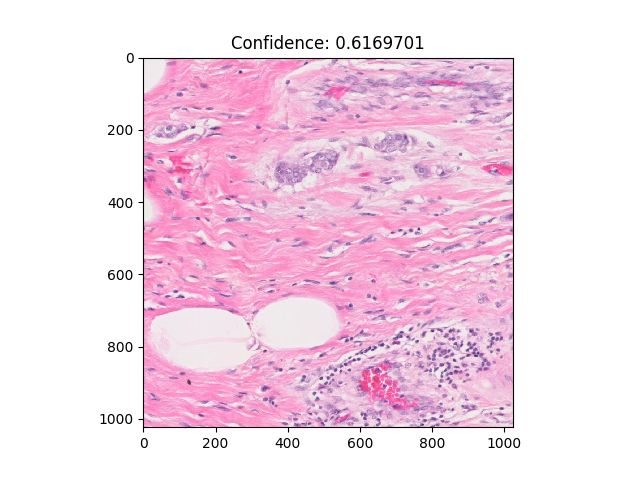
Usage: python3 patch_visualizer.py --which_fold = placeholder_fold_number. Output displays in new window, patches
can be scrolled through using arrow keys, as well as number keys to jump to the corresponding decile (ex. hitting 4
goes to the 40th percentile). Hitting the '-' key moves to the slide with the highest confidence.
Description: Displays patches for test patients in a given fold. Patches are shown with their confidence value for being classified as positive.
Relevant Constants:
* `CONFIDENCE_CONTAINER_LIST`
Example:
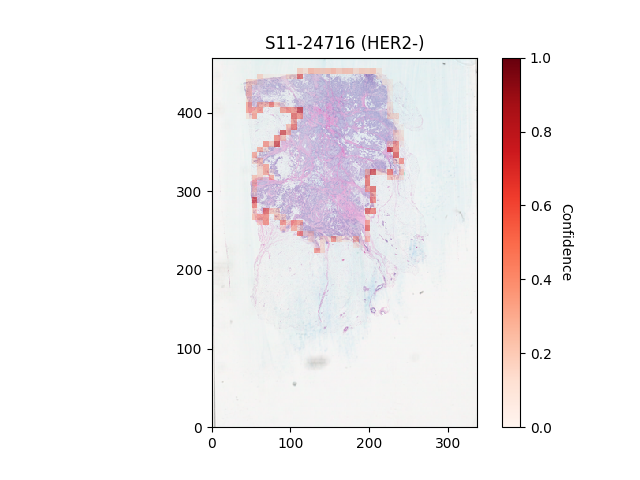
Usage: python3 view_confidence_heatmaps.py --which_fold = placeholder_fold_number. Output displays in a new window,
slides can be scrolled through using arrow keys.
Description: Overlays heatmaps onto whole slide image thumbnails describing the confidence of patches being classified as positive.
Relevant Constants:
* `PATCH_NAME_TO_COORDS_MAP`
* `SLIDE_NAME_TO_TILE_DIMS_MAP`
* `SLIDE_NAME_TO_PATCHES_MAP`
* `PATCH_NAME_TO_CONFIDENCE_MAP`
* `TEST_SLIDE_FOLDER`
* `TEST_SLIDE_LIST`
* `SLIDE_FILE_DIRECTORY`
Example: