
ESP-IDF Eclipse Plugin brings developers an easy-to-use Eclipse-based development environment for developing ESP32-based IoT applications. It provides better tooling capabilities, which simplifies and enhances standard Eclipse CDT for developing and debugging ESP32 IoT applications. It offers advanced editing, compiling, flashing and debugging features with the addition of Installing the tools, SDK configuration and CMake editors.
The plug-in runs on macOS, Windows and Linux platforms.
![]()
![]()
![]()
Note: It supports ESP-IDF CMake based projects (4.x and above).
To get a quick understanding of ESP-IDF and Eclipse plugin features, check our session which was presented in EclipseCon 2020.
Get Started
Other IDE Features
- Installing ESP-IDF and Tools via Tools Installation Wizard
- Configuring the Project using sdkconfig Editor
- CMake Editor
- ESP-IDF Application Size Analysis Editor
- Installing ESP-IDF Components
- ESP-IDF Terminal
- Configuring Build Environment Variables
- Configuring Core Build Toolchain
- Configuring CMake Toolchain
- Selecting Clang Toolchain
- Configuring the flash arguments
- Installing IDF Eclipse Plugin from Eclipse Market Place
- Installing IDF Eclipse Plugin using local archive
- Upgrading IDF Eclipse Plugin
- Importing an existing IDF Project
- Importing an existing Debug launch configuration
- Device Firmware Upgrade (DFU) through USB
- GDBStub Debugging
- Core Dump Debugging
- Application Level Tracing
- ESP-IDF master update
- Partition Table Editor UI for ESP-IDF
- NVS Table Editor
- Write Binary Data to Flash
- Changing Language
- Wokwi Simulator
We recommend using the Espressif-IDE instead of the Eclipse CDT + IEP Plugin update approach to avoid the hassles of updating.
- Download the Espressif-IDE with ESP-IDF Offline Windows Installer and follow the instructions provided here. This guide will walk you through the installation process for Java, Git, CMake, ESP-IDF, IDF Tools, Device Drivers, and Espressif-IDE to help you get started.
- To begin, download the Espressif-IDE for your respective operating system. Following this, launch the IDE and proceed to install the necessary ESP-IDF and related tools. Please note that prior to launching the IDE, you must ensure that Java, Python, and Git are installed as prerequisites. and available in the system path.
If you plan to use Eclipse CDT and update it through the IDF Eclipse plugin, please ensure that you download the supported version for your operating system from here .
The minimum requirements for running the Espressif-IDE are below.
- Java 17 and above : Download and install Java SE from here.
- Python 3.6 and above : Download and install Python from here.
- Git : Get the latest git from here.
Note: Make sure Java, Python and Git are available on the system environment PATH.
You can install the IDF Eclipse plugin into an existing IDE using the update site URL. First, add the release repository URL as follows:
- Go to
Help>Install New Software. - Click
Add…, and in the pop-up window:- Enter
NameasEspressif IDF Plugin for Eclipse - Enter
Locationof the repository:- Stable release: https://dl.espressif.com/dl/idf-eclipse-plugin/updates/latest/
- Click
Add.
- Enter
- Select
Espressif IDFfrom the list and proceed with the installation.
For adding beta and nightly builds, you can use the following update site urls.
- Beta version: https://dl.espressif.com/dl/idf-eclipse-plugin/updates/beta/
- Nightly build: https://dl.espressif.com/dl/idf-eclipse-plugin/updates/nightly/
Note: While the screenshots are captured on macOS, the installation instructions are applicable to Windows, Linux, and macOS.

To install ESP-IDF directly from the Eclipse:
- Go to
Espressif>Download and Configure ESP-IDF. - From the
Download ESP-IDFsection, choose ESP-IDF version and directory to download. - Click on
Finish.
To configure an existing ESP-IDF:
- Go to
Espressif>Download and Configure ESP-IDF. - Check
Use an existing ESP-IDF directory from the file system. - Choose an existing ESP-IDF directory from the file system.
- Click on
Finish.
This will download a specified ESP-IDF version and configure IDF_PATH in the Eclipse CDT build environment variables.

ESP-IDF requires the installation of several prerequisite tools to build firmware for the ESP32. These tools include Python, Git, cross-compilers, the menuconfig tool, CMake, and Ninja build tools.
Follow the below instructions to get started.
- Navigate to
Espressif>ESP-IDF Tools Manager>Install Tools. - Provide the
ESP-IDF Directorypath. - Provide
GitandPythonexecutable locations if they are not auto-detected. - Click on
Install Toolsto proceed with the installation process. Check the Console for the installation details. - Installation might take a while if you're doing it for the first time since it has to download and install
xtensa-esp32-elf,esp32ulp-elf, Cmake,openocd-esp32and Ninja tools.
Note: Ensure that you perform this step even if you have already installed the necessary tools. This step sets the IDF_PATH, PATH, OPENOCD_SCRIPTS, and IDF_PYTHON_ENV_PATH in the Eclipse CDT build environment based on the idf_tools.py export command.

ESP-IDF Directory selection dialog:

- Make sure you are in
C/C++ Perspective. - Go to
File>New>Espressif IDF Project - Provide the
Project name(The ESP-IDF build system does not support spaces in the project path). - Click
Finish.
To create a project using existing ESP-IDF templates, please refer to this.
Note: You may see numerous unresolved headers and symbols errors in the editor, and these will only be resolved after the build process.

Next, you should select the ESP target for your project. By default, the launch target drop-down will display all the supported targets by the plugin.

However, if you would like to add a target that is not available in the launch target drop-down, please follow the instructions below.
- Click on the launch target dropdown.
- Select
New Launch Target. - Select
ESP Target. - Provide properties for the target where you would like to launch the application. Enter a
Namefor the target and select theSerial Portyour ESP device is connected to on your machine.

- Select a project from the
Project Explorer. - Select
Runfrom the first drop-down, which is calledLaunch Mode. - Select your application from the second drop-down, which is called
Launch Configuration(Auto-detected). - Select a target from the third drop-down, which is called
Launch Target. - Now click on the
Build button to start with a build process.

Flash operation can be initiated with just a click of a launch button ![]() and it's auto-configured to flash the application with the default flash command i.e,
and it's auto-configured to flash the application with the default flash command i.e, idf.py -p PORT flash.

To provide the customized flash arguments, please follow this link for further instructions.
To configure flashing via JTAG, please refer to this JTAG Flashing guide.
To see the serial output in Eclipse, we need to configure the ESP-IDF Serial Monitor to connect to the serial port. This is integrated with the IDF Monitor. Please check more details here.

- Click on the
Open a Terminalicon from the toolbar. - Choose
ESP-IDF Serial Monitorfrom the terminal drop-down. - Select
Serial Portfor your board if it's not detected. - Configure serial monitor filter options for output filtering.
- Click on
OKto launch the terminal, which will listen to the USB port.

ESP-IDF Serial Monitor will allow you to configure the default settings of the serial monitor character limit and number of lines.
- Navigate to
Espressiffrom the Eclipse Preferences. - Click on
ESP-IDF Serial Monitor Settings. - Provide
Console Line WidthandLimit Console Output.
In most cases, only two things are required to start debugging an esp-idf project:
- Create a debug configuration
- Check whether the board in the created configuration corresponds to the board in use.
Note: If you're using Windows, you may need to install drivers using Zadig to run a debug session successfully. For detailed instructions, please refer to this guide.
The fastest way to create a debug configuration is to expand the configuration list in the launch bar and click New Launch Configuration.... Then select ESP-IDF GDB OpenOCD Debugging -> Double Click or Next. After that, the preview for the new debug configuration will open where it's necessary to check the board.
After creating the debug configuration, you can go ahead and debug the project. Select the configuration you just created, select debug mode, and click on the "Debug" icon ![]() to start debugging:
to start debugging:

To learn more about the debug configuration, please refer to GDB OpenOCD Debugging.
- Make sure you're in
C/C++ Perspective. - Go to
File>New>Espressif IDF Project(If you don't see this, please reset the perspective fromWindow>Perspective>Reset Perspective..). - Provide the
Project name. - Click
Next. - Check
Create a project using one of the templates. - Select the required template from the tree.
- Click
Finish.
Note: You will see a lot of unresolved inclusion errors in the editor and those will be resolved only after the build.

You can use the Tools Installation Wizard to manage the tools installation via a wizard. The advantage of this method over the existing installation is that you can easily manage the whole flow via the wizard and install the tools in ESP-IDF framework that you only need.
To get started:
-
Navigate to
Espressif>ESP-IDF Tools Manager>Tools Installation Wizard (Preview).
-
The wizard will start and you can select the location for the Git and Python, if they are already present on the system PATH or registry the tools will be populated. After selection, you can click
Next.
-
Next page will let you select the folder for existing ESP-IDF or you can also select from the drop down list to download the available versions. You can also select master from the list to clone the master for ESP-IDF from GitHub.

-
After you select
Nextyou will see the list of all the available tools in the selected ESP-IDF version, this page lets you select only the recommended tools or you can select the tools you want to. You can also filter out the tools via the filter text box or based on the target. The wizard page is the last page and will Install and Download if necessary all the selected tools required. After you have installed all the tools you can finish the wizard and start creating projects.


Project configuration is held in a single file called sdkconfig in the root directory of the project. This configuration file can be modified using SDK Configuration Editor
To launch the SDK Configuration editor:
- Navigate to
sdkconfigfile. - Double-click on the file to launch the SDK configuration editor.
- Use
Ctrl+SorCommand+Sbased on the OS environment to save the changes. You can also use EclipseSavebutton from the toolbar. - To revert the sdkconfig editor changes, you can either close the editor without saving them or you can right-click on the
sdkconfigfile and selectLoad sdkconfigmenu option to revert the changes from the editor.

CMake Editor Plug-in is integrated with IDF Plugin for editing CMake files such as CMakeLists.txt. It provides syntax coloring, CMake command content assist, and code templates.

CMake editor preferences can be controlled using Eclipse > Preferences > CMakeEd.

The Application Size Analysis editor provides a way to analyze the static memory footprint of your application. It has two sections:
- The Overview section provides a summary of the application's memory usage;
- The Details section will have in-depth details about components and per-symbol level memory information.
Details table viewer also provides you with searching and sorting capabilities on various columns.
To launch the Application Size Analysis editor:
- Right-click on the project.
- Select
ESP-IDF: Application Size Analysismenu option to launch the editor.
Application Size Analysis - Overview

Application Size Analysis - Details

This would launch a local terminal with all the environment variables which are set under Preferences > C/C++ > Build > Environment. The default working directory would be either the currently selected project or IDF_PATH if there is no project selected.
The terminal PATH is also configured with esptool, espcoredump, partition_table, and app_update component paths so that it will be handy to access them directly from the ESP-IDF terminal.
To launch the ESP-IDF Terminal:
- Click on the
Open a Terminalicon from the toolbar. - Choose
ESP-IDF Terminalfrom the terminal drop-down and clickOKto launch a terminal.

You can install the ESP-IDF Components directly into your project from the available components online. Follow the steps below:
-
Right-click on the project from
Project Explorerin which you want to add the component to and SelectInstall ESP-IDF Components.
A new window will open up showing all the available component to be installed.
-
From the window, you can click on
Installbutton to add that component to the project. To get to the readme file for that component you can click onMore Infowhich will open the browser link to the readme file of that component.


Already added components are also shown but the Install button changes text to Already Added and is disabled.
Eclipse configures automatically the required environment variables in the Preferences > C/C++ Build > Environment section if IDF Tools are installed using Espressif > ESP-IDF Tools Manager > Install Tools menu option. Required environment variables:
IDF_PATHPATHOPENOCD_SCRIPTSIDF_PYTHON_ENV_PATH
If the required environment variables are not configured for any reason, please follow the step-by-step instructions below.
- Click on the
Environmentpreference page underC/C++ Build. - Click
Add…again, and enter nameIDF_PATH. The value should be the full path where ESP-IDF is installed. - Similarly, we should configure
OPENOCD_SCRIPTS,IDF_PYTHON_ENV_PATHandPATHenvironment variables.
This is how they should look:
/Users/user-name/esp/esp-idf
/Users/user-name/.espressif/tools/openocd-esp32/v0.10.0-esp32-20190313/openocd-esp32/share/openocd/scripts
/Users/user-name/.espressif/python_env/idf4.0_py3.7_env
/Users/user-name/.espressif/tools/xtensa-esp32-elf/esp32-2019r1-8.2.0/xtensa-esp32-elf/bin:/Users/user-name/.espressif/tools/esp32ulp-elf/2.28.51.20170517/esp32ulp-elf-binutils/bin:/Users/user-name/.espressif/tools/cmake/3.13.4/CMake.app/Contents/bin:/Users/user-name/.espressif/tools/openocd-esp32/v0.10.0-esp32-20190313/openocd-esp32/bin:/Users/user-name/.espressif/tools/ninja/1.9.0/:/Users/user-name/.espressif/python_env/idf4.0_py3.7_env/bin:/Users/user-name/esp/esp-idf/tools:$PATH

We need to tell Eclipse CDT what core build toolchain and CMake toolchain to use to build the project. However, this will be auto-detected if you've installed the tools using the Espressif > ESP-IDF Tools Manager > Install Tools option from Eclipse.
If these toolchains are not detected for any reason, please follow the step-by-step instructions below to add a new toolchain.
-
Open Eclipse Preferences.
-
Navigate to
C/C++>Core Build Toolchainspreference page. -
Click on
Add..from the user-defined toolchains tables. -
Select
GCCas a toolchain type. -
Click on
Next. -
Provide the GCC toolchain settings:
- Compiler: /Users/user-name/esp/xtensa-esp32-elf/bin/xtensa-esp32-elf-gcc,
- Operating System: esp32,
- CPU Architecture: xtensa

We now need to tell CDT which toolchain to use when building the project. This will pass the required arguments to CMake when generating the Ninja files.
- Navigate to
C/C++>CMakepreference page. - Click
Add...and this will launch the New CMake toolchain configuration dialog. - Browse CMake toolchain
Path. Example:/Users/user-name/esp/esp-idf/tools/cmake/toolchain-esp32.cmake. - Select GCC Xtensa toolchain compiler from the drop-down list. Example:
esp32 xtensa /Users/user-name/esp/xtensa-esp32-elf/bin/xtensa-esp32-elf-gcc.
Note: Eclipse CDT has a bug in saving the toolchain preferences, hence it's recommended to restart Eclipse before we move further configuring the launch target.

With ESP-IDF Eclipse Plugin v2.7.0 and higher you can build your project with the Clang toolchain
- After updating/installing the ESP-IDF Eclipse plugin to v2.7.0 or higher, you need to run
Espressif>ESP-IDF Tools Manager>Install Toolsto update the toolchain list and environment variables, that are necessary for Clang toolchain. - After creating a new project, edit the project configuration

- Go to
Build Settingstab and select clang toolchain there: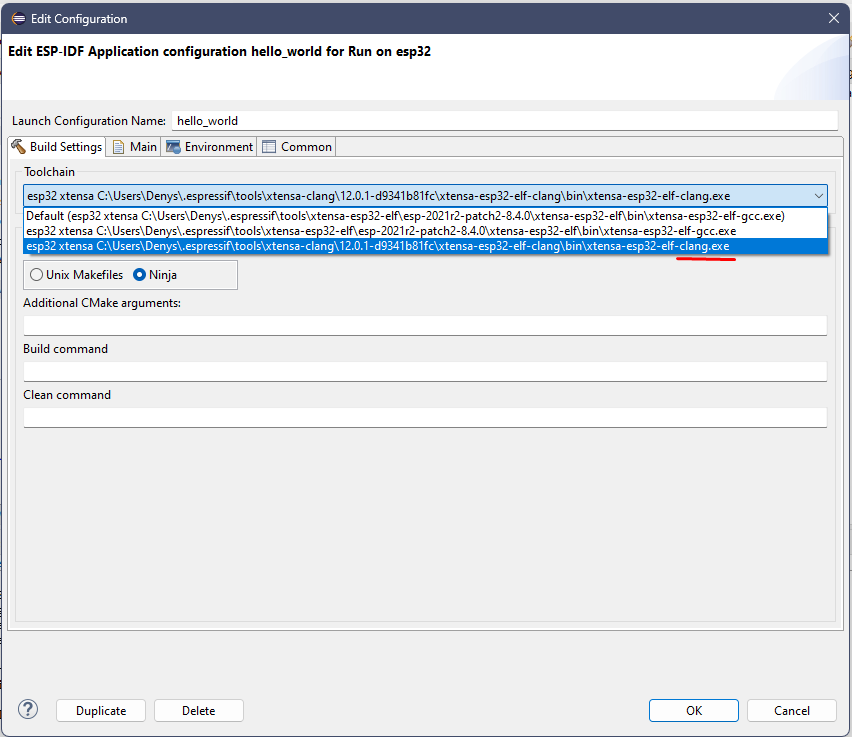
Note: Clang toolchain now is an experimental feature and you may face some build issues due to the incompatibility of esp-idf. Below is a description of how to fix the most common build issue on the current ESP-IDF master (ESP-IDF v5.1-dev-992-gaf28c1fa21-dirty). To work around clang build errors please refer to this.
To provide the customized launch configuration and flash arguments, please follow the step-by-step instructions below.
- Click on the
Launch Configurationedit button. - Switch to the
Maintab. - Specify the
Locationwhere this application has to run. Sinceidf.pyis a python file, will configure the python system path. Example:${system_path:python}. - Specify
Working directoryof the application. Example:${workspace_loc:/hello_world}. - In additional arguments, provide a flashing command which will run in the specified working directory.
- Flash command looks like this:
/Users/user-name/esp/esp-idf/tools/idf.py -p /dev/cu.SLAB_USBtoUART flash. - Click OK to save the settings.
- Click on the
Launchicon to flash the application to the selected board.


To change the plugin language a menu is provided to show the list of available languages for the plugin.
- Click on the
Espressifmenu from the menu bar. - Select the
Change Languagefrom the drop-down menu. - From the sub menu select the language you want.
- Eclipse will restart with selected language.

Remember this will only change the language of the Eclipse if the required language bundles for the selected language are installed or else only the plugin interfaces will be changed.
If you run into a problem during a build, chances are that there is a hint for this error in the ESP-IDF hint database, which is stored in tools/idf_py_actions/hints.yml of ESP-IDF. The ESP-IDF Eclipse plugin provides a hint viewer where you can type an error message and find a hint for it.
Prerequisites for it is to have hints.yml, which is available from ESP-IDF v5.0 and higher. If you are using lower versions of ESP-IDF, you can still use the hints viewer. To do it, you have to manually download the hints.yml file from here and put it to your esp-idf/tools/idf_py_actions/ path. To download a file from GitHub, right-click the Raw button and then Save as....
To open the hints viewer go to Windows -> Show View -> Other... -> Espressif -> Hints. You will see the following view:
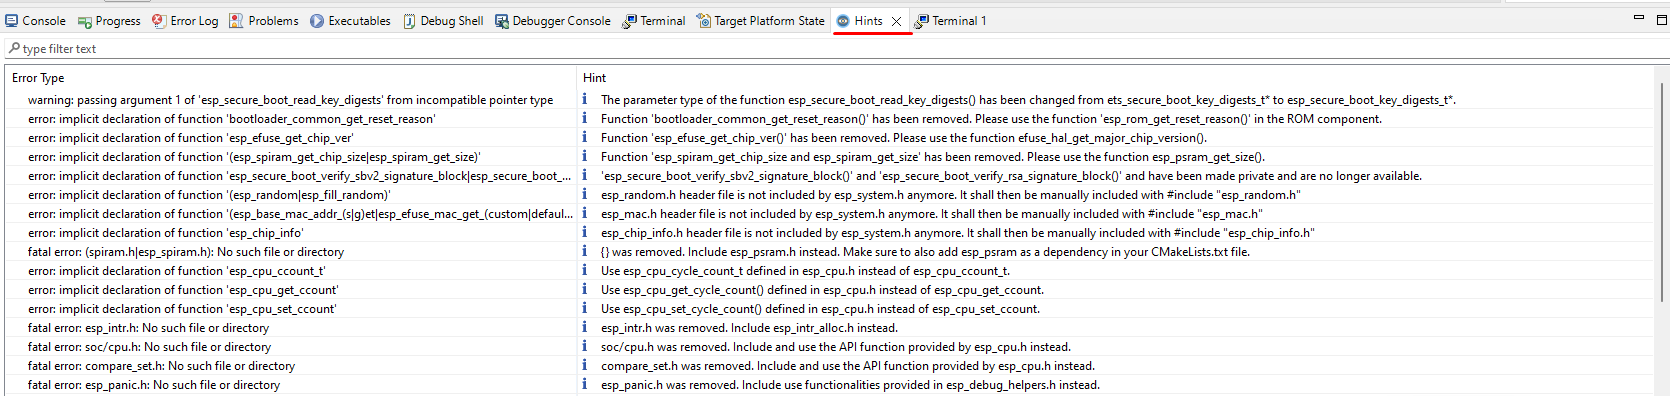
Now you can type or copy paste some error from the build log, for example:
ccache error: Failed to create temporary file for esp-idf/libsodium/CMakeFiles/..../....: No such file or directory

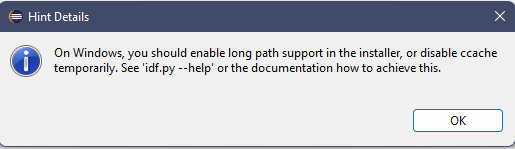
Double-clicking on the row will give you a hint message, so you can clearly see it if it doesn't fit on your screen in the table view.
The Error Log view captures all the warnings and errors logged by plug-ins. The underlying log file is a .log file stored in the .metadata subdirectory of the workspace.
The Error Log view is available in Window > Show View > Error Log.
To export the current log view content into a file, press the Export Log toolbar button or select Export Log... from the context menu. Then, enter a file name.
Always provide an error log when reporting an issue.

The Console View provides all the warnings and errors related to the current running process or build. To access the console view.
From the menu bar, Window > Show View > Console.

Go to Preferences > C/C++ > Build > Logging
The Espressif IDF Tools Console is part of the Console view, this will be opened only during the installation of IDF tools from the Eclipse.
If you encounter any issue while installing the IDF tools using Espressif > ESP-IDF Tools Manager > Install tools, please check the Espressif IDF Tools Console to see the errors reported.
If this is not active, it can be switched by clicking on the Display Selected Console icon from the console view.

Please refer to this doc.
Please follow the steps below to install IDF Eclipse Plugin from the Eclipse Market Place.
- In Eclipse, choose
Help>Eclipse Market Place.... - Enter
ESP-IDF Eclipse Pluginin the search box to find the plugin. - Click on
Installto follow the installation instructions. - Restart the Eclipse.

- Download the latest update site archive for IDF Eclipse Plugin here - https://github.com/espressif/idf-eclipse-plugin/releases.
- In Eclipse, choose
Help>Install New Software. - Click
Add…button. - Select
Archivefrom Add repository dialog and select the filecom.espressif.idf.update-vxxxxxxx.zip. - Click
Add. - Select
Espressif IDFfrom the list and proceed with the installation. - Restart the Eclipse.

If you are installing IDF Eclipse Plugin into your Eclipse for the first time, you first need to add the new release's repository as follows:
Window>Preferences>Install/Update>Available Software Sites.- Click
Add. - Enter the URL of the new repository https://dl.espressif.com/dl/idf-eclipse-plugin/updates/latest/.
- Click
Ok.
If you've already installed IDF Eclipse Plugin using update site URL, you can get the latest changes by following the steps below:
Help>Check for Updates.- If updates are found, select
Espressif IDF Plugins for Eclipseand deselect all other items. - Click
Nextto proceed with the installation.

- Make sure you're in
C/C++ Perspective. - Right-click in the
Project Explorer. - Select
Import..Menu. - Select
Existing IDF ProjectfromEspressifimport wizard menu list. - Click
Next. - Click on
Browse...to choose an existing project location directory. - Provide
Project nameif you wish you have a different name. - Click
Finishto import the selected project into Eclipse workspace as a CMake project.

To import an existing launch configuration into Eclipse:
- Select
Import...from theFilemenu. - In the Import dialog box, expand the
Run/Debuggroup and selectLaunch Configurations. - Click on
Next. - Click on
Browse...to select the required location in the local file system. - Select the folder containing the launch files and then click
OK. - Select the checkboxes for the required folder and launch file.
- If you are replacing an existing configuration with the same name then select
Overwrite existing launch configurations without warning. - Click on
Finish.
You can now use the GDBStub debugging inside our Eclipse plugin to help you diagnose and debug issues on chips via Eclipse when it is in panic mode.
To enable GDBStub debugging for a project:
-
Launch the
sdkconfigin project root by double-clicking on it which will open the configuration editor.
-
Expand the
Component Configsection and selectESP System Settings. From the settings on the right forPanic Handler behaviourselect theGDBStub on Panic optionfrom the list.


Now you will be taken to the GDBStub debugger automatically when you connect the serial monitor and there is a panic for this example.
To use the GDBStub debugging for a project:
-
Create a template
hello_worldproject and add the following lines in the main c file.This is a global variable<br/> COREDUMP_DRAM_ATTR uint8_t global_var; -
Now add these two lines just above the
esp_restart()functionglobal_var = 25; assert(0);
The final file should be something like this:

Build and flash the project and launch the serial monitor. On line number 45, we are signaling for a failing assert which will put the chip in panic mode and when that line reaches, you will be prompted to switch the perspective to debug mode and the chip will be halted.
Remember that this is a panic mode and you cannot continue the execution from here, you will have to stop and restart the chip through IDF commands or simply restart the serial monitor.

You can view the registers stack trace and even view the value of variables in the stack frame.
To exit the debug session simply press stop button.
The IDF-Eclipse plugin allows you to debug the core dump if any crash occurs on the chip and the configurations are set. Currently only the UART core dump capture and debugging is supported.
To enable core dump debugging for a project:
-
You need to enable it first in
sdkconfig. Launch thesdkconfigin the project root by double-clicking on it which will open the configuration editor -
Click on the
Core Dumpfrom the settings on the left and selectData DestinationasUART.

This will enable the core dump debugging and whenever you connect a serial monitor for that project if any crash occurs it will load the dump and open a debug perspective in Eclipse to let you diagnose the dump where you can view all the information in the core dump.
You can view the registers stack trace and even view the value of variables in stack frame.
To exit the debug session: simply press stop button.
Device Firmware Upgrade (DFU) is a mechanism for upgrading the firmware of devices through Universal Serial Bus (USB). There are a few requirements that need to be met:
- DFU is supported by ESP32-S2 and ESP32-S3 chips.
- You will need to do some electrical connection work (Here is a guide for the ESP32-S2 board). The necessary connections for the USB peripheral are shown in the following table.
| GPIO | USB |
|---|---|
| 20 | D+ (green) |
| 19 | D- (white) |
| GND | GND (black) |
| +5V | +5V (red) |
After meeting the above requirements:
- The chip needs to be in bootloader mode for the detection as a DFU device and flashing. This can be achieved by pulling GPIO0 down (e.g. pressing the BOOT button), pulsing RESET down for a moment and releasing GPIO0.
- Install USB drivers (Windows only). The drivers can be installed by the Zadig tool.
- Please make sure that the device is in download mode before running the tool and that it detects the device before installing the drivers.
- The Zadig tool might detect several USB interfaces of the target. Please install the WinUSB driver for only that interface for which there is no driver installed (probably it is Interface 2) and don't re-install the driver for the other interface.
- The manual installation of the driver in Device Manager of Windows is not recommended because the flashing might not work properly.
After meeting the above requirements, you are free to build and flash via DFU. How to use DFU:
- Edit the active launch configuration.
- In the main tab, select the
Flash over DFUoption. - Select a suitable IDF target for DFU
- Now, if you use the build command, an extra file (dfu.bin) will be created, which can be used later for flashing.

Additional information, including common errors and known issues, is mentioned in this guide.
ESP-IDF provides a useful feature for program behavior analysis called Application Level Tracing. IDF-Eclipse plugin has UI, that allows the use of start, and stop tracing commands and process received data. To familiarize yourself with this library, you can use the app_trace_to_host project or the app_trace_basic project if you are using esp-idf 5.1 and higher. These projects can be created from the plugin itself:

Before you start using application-level tracing, it is important to create a debug configuration for the project where you must select the board you are using in order to successfully start the OpenOCD server.

After debug configuration is created, right-click on the project in the Project Explorer and click on ESP-IDF:Application Level Tracing:

It can take a while to open the application level tracing dialog because the OpenOCD server starts first, so you don't need to start it externally. At the very top of the application-level trace dialog, there are auto-configured fields that you can change for the trace start command.
Start command:
- Syntax:
start <outfile> [poll_period [trace_size [stop_tmo [wait4halt [skip_size]]]] - Argument:
outfile: Path to file to save data from both CPUs. This argument should have the following format:file://path/to/file.poll_period: Data polling period (in ms) for available trace data. If greater than 0 then command runs in non-blocking mode. By default, 1 ms.trace_size: Maximum size of data to collect (in bytes). Tracing is stopped after specified amount of data is received. By default -1 (trace size stop trigger is disabled).stop_tmo: Idle timeout (in sec). Tracing is stopped if there is no data for a specified period of time. By default -1 (disable this stop trigger). Optionally set it to a value longer than the longest pause between tracing commands from the target.wait4halt: If 0 start tracing immediately, otherwise command waits for the target to be halted (after reset, by breakpoint etc.) and then automatically resumes it and starts tracing. By default, 0.skip_size: Number of bytes to skip at the start. By default, 0.
Additional information can be found here.

The next two fields Trace Processing Script and Start Parsing Command are used to parse the output file.
Trace Processing Scriptis used to provide the path to the parsing script, by default it is logtrace_proc.py from esp-idf.Start Parsing Commandallows you to check the resulting parsing command and edit it if it's necessary. By default, this field is automatically configured to match$IDF_PATH/tools/esp_app_trace/logtrace_proc.py/path/to/trace/file/path/to/program/elf/file.
Note the Start parse button is disabled until a dump file is available. To generate it, click the Start button at the bottom of the dialog box. After you click, the button changes to Stop so that you can stop tracking.
When the output file is generated, you can click on Start parse button, and you will see the parsed script output in the Eclipse console:

If you are using the master version of ESP-IDF and want to update it, you can do so in the plugin by going to Espressif -> ESP-IDF Tool Manager and clicking the Update ESP-IDF master command there.
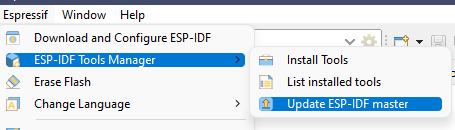
Note: This command is visible only if you are on the master branch in ESP-IDF.
ESP-IDF: Partition Table Editor command allows to edit your partition table in a more convenient way, where you can see the supported types and subtypes and monitor the correctness of the entered data.
Note: This command is available in the IDF-Eclipse plugin 2.8.0 and higher.
Steps:
-
Go to
Project Explorer, open any IDF Project where you want to have a customized partition table. -
In
Project Explorer, right-click on the project and click onESP-IDF: Partition Table Editorcommand: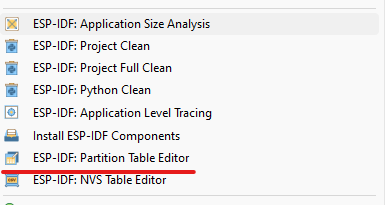
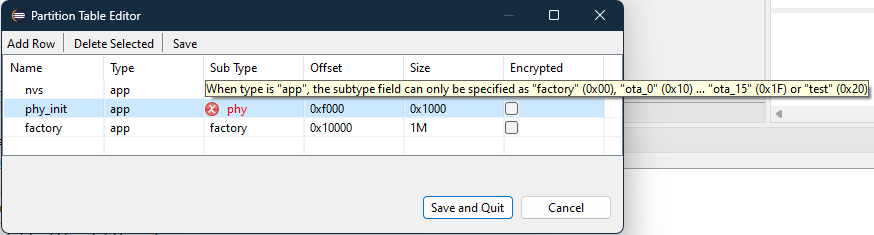
When opening the partition table editor for the selected project, you will see the standard editable content. Errors (if any) will be highlighted. You can hover your mouse over it to get a hint of what it is about:
-
Click "Save" or "Save and Quit" to save your changes.
To use a customized partition table:
-
Go to
sdkconfigand setCustom partition table CSVlike below:
NVS Table Editor helps to create a binary file based on key-value pairs provided in a CSV file. The resulting binary file is compatible with NVS architecture defined in ESP_IDF Non Volatile Storage. The expected CSV format is:
	key,type,encoding,value     <-- column header (must be the first line)
	namespace_name,namespace,,  <-- First entry must be of type "namespace"
	key1,data,u8,1
	key2,file,string,/path/to/file
Note: This is based on ESP-IDF NVS Partition Generator Utility.
Steps:
-
Right-click on project in the
Project Explorer -
Select the
ESP-IDF: NVS Table Editorcommand: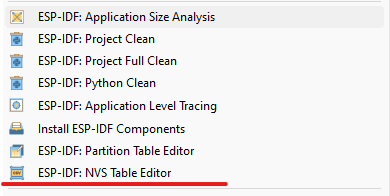
Note: This command is available in the IDF-Eclipse plugin 2.8.0 and higher
-
Make desired changes to CSV data
-
Save changes by clicking the
Savebutton. If everything is ok, you will see an information message at the top of the dialog: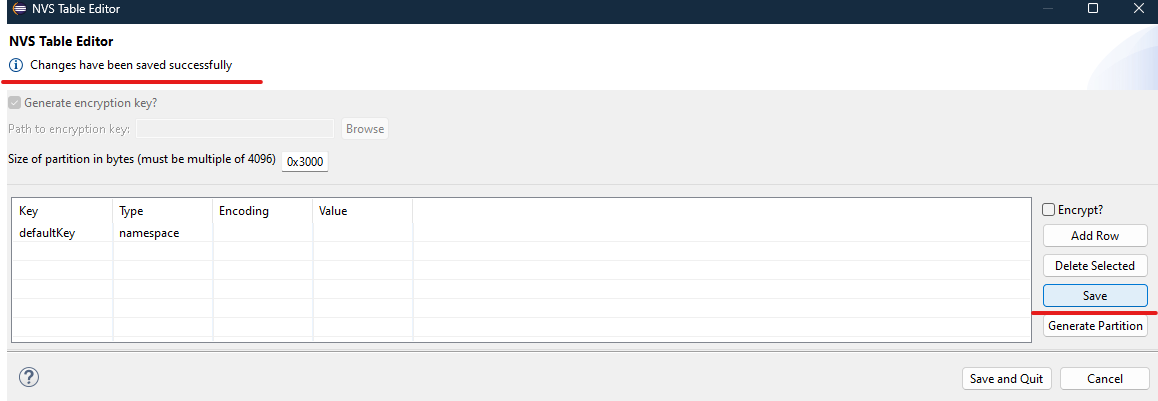
-
Generate the partition binary (Choose
encryptto encrypt the binary and disable the generate key option to use your own key if desired). You will see an information message at the top of the dialog about the result of generated binaries. You can hover your mouse over it to read the whole message if it's too long: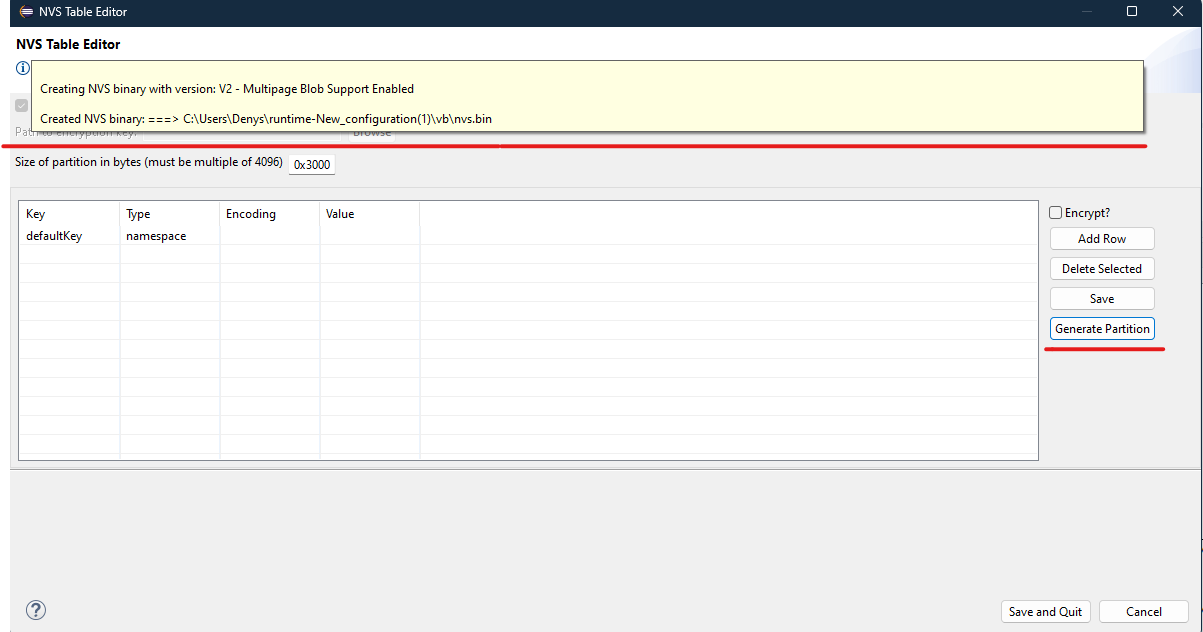
Note: If there are any errors, you will see them highlight, hover on the error icon to read more about the error. Also, you will see an error message at the top of the dialog if saving the CSV file is not successful:

After all these steps, you should see nvs.csv and nvs.bin files in the project directory.
Binary data can be written to the ESP’s flash chip via ESP-IDF: Write Binary Data to Flash command accessible by right click on the project in the project explorer:

After clicking this command, the Write Binary Data to Flash dialog box will open. Editable default values are provided for binary path and offset. The correct offset can be checked by looking at the partition table via ESP-IDF: Partition Table Editor or manually by opening the partitions.csv file

After clicking on the Flash button the result of the flash command will be printed inside of this dialog.
-
Install prerequisites Java 11+ and Maven.
-
Run the below commands to clone and build.
git clone https://github.com/espressif/idf-eclipse-plugin.git
cd idf-eclipse-plugin
mvn clean verify -Djarsigner.skip=true
This will generate p2 update site artifact:
- Name:
com.espressif.idf.update-* - Location:
releng/com.espressif.idf.update/target
This artifact can be installed using the mechanism mentioned here
- Go to the last commit of the master branch here.
- Click on a ✅ green tick mark.
- Click on
Details. - Click on
Summaryon the left. - Scroll down to see the
Artifactssection. - Download
com.espressif.idf.updatep2 update site archive and install as per the instructions mentioned here.
IDE allows configuring a custom build directory to the project:
- Select a project and click on a launch configuration
Editbutton from the top toolbar and this will the launchEdit Configurationwindow. - Navigate to the
Build Settingstab. - In the
Additional CMake Argumentssection, provide a custom build directory with arguments-B <custom build path>with an absolute path. Customized build directory path could be within the project or a path from the file system. For example:-B /Users/myUser/esp/generated. - Click on
Okand build the project.
Note this configuration changes where all the project build artifacts will be generated.

- Install
wokwi-serveras mentioned here - In the Eclipse CDT build environment variables, configure
WOKWI_SERVER_PATHwith the wokwi-server executable path (Preferences>C/C++>Build>Environment). - Create a new
Run launch configurationwith theWokwi Simulator. - Choose a project and add the project ID of the Wokwi project. The ID of a Wokwi project can be found in the URL. E.g., the URL of project ESP32 Rust Blinky is https://wokwi.com/projects/345932416223806035 and the project ID is 345932416223806035.
- Click
Finishto save the changes. - From the IDE Toolbar, click on the
Launchbutton to launch the Wokwi simulator. - Wokwi Simulator will be launched in the external browser. The serial monitor output is also displayed in the Eclipse CDT build console.
- To kill a Wokwi simulator, click on the
Stopbutton from the toolbar.
| IEP | Eclipse | Java | Installer | Description |
|---|---|---|---|---|
| IEP 2.12.1 | Eclipse 2023-03 to Eclipse 2023-12 | Java 17 and above | espressif-ide-setup-2.12.1-with-esp-idf-5.2.exe | |
| IEP 2.12.0 | Eclipse 2023-03, Eclipse 2023-06, Eclipse 2023-09 | Java 17 and above | espressif-ide-setup-2.12.0-with-esp-idf-5.1.2 | |
| IEP 2.11.0 | Eclipse 2023-03, Eclipse 2023-06, Eclipse 2023-09 | Java 17 and above | espressif-ide-setup-2.11.0-with-esp-idf-5.1.1.exe | |
| IEP 2.10.0 | Eclipse 2022-09,2022-12,2023-03 | Java 17 and above | espressif-ide-setup-2.10.0-with-esp-idf-5.0.1.exe | |
| IEP 2.9.1 | Eclipse 2022-09 and Eclipse 2022-12 | Java 17 and above | espressif-ide-setup-2.9.0-with-esp-idf-5.0.1.exe | For Windows Users, it's recommended to use the Windows Offline Installer and upgrade to the latest IEP v2.9.1 plugin |
| IEP 2.9.0 | Eclipse 2022-09 | Java 17 and above | espressif-ide-setup-2.9.0-with-esp-idf-5.0.1.exe | For Windows, it's recommended to use the Windows Offline Installer |
Please raise the issues here with the complete environment details and log.