Table Coloring
Column colors can be set by right clicking in the column header and choosing 'set color'. A color picker will open. The formatting is saved with the project file. You can clear the formatting from the table popup menu.
You can set column colors by setting the key in the columncolors dict to a valid hex color code. Then just redraw.
table.columncolors['mycol'] = '#dcf1fc' #color a specific column
table.redraw()
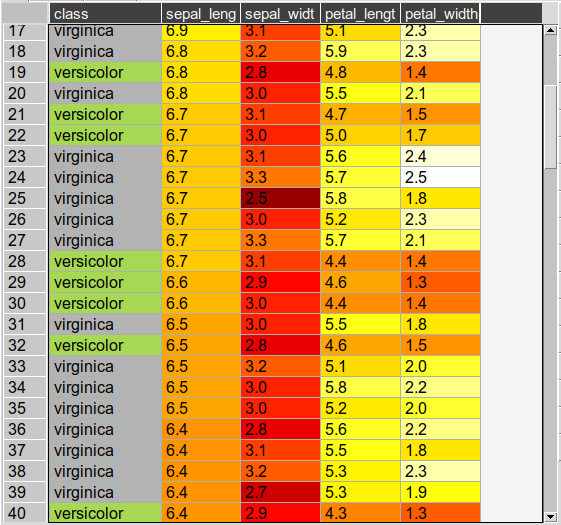
You can set row and cell colors in several ways. Firstly, if right clicking on the row header or inside the table the 'set color' option lets you color the selected rows/columns with a single color. You can also set colors for the entire table/column according to the cell values. This is done by choosing 'color by value' from the column header and will allow you to select a color map. String values will be mapped to categorical integers and then to colors. See below:
For very large tables, adding colors for all cells will increases the file size of saved projects.
table.rowcolors is a pandas dataframe that mirrors the current table and stores a color for each cell. It only adds columns as needed. You can update this manually but it is easiest to use the following methods:
table.setRowColors(rows, color) #using row numbers
table.setColorByMask(column, mask, color) #using a pre-defined mask
table.redraw()
To color by values:
table.multiplecollist = [cols] #set the selected columns
table.setColorbyValue()
table.redraw()
To clear formatting:
table.clearFormatting()
table.redraw()