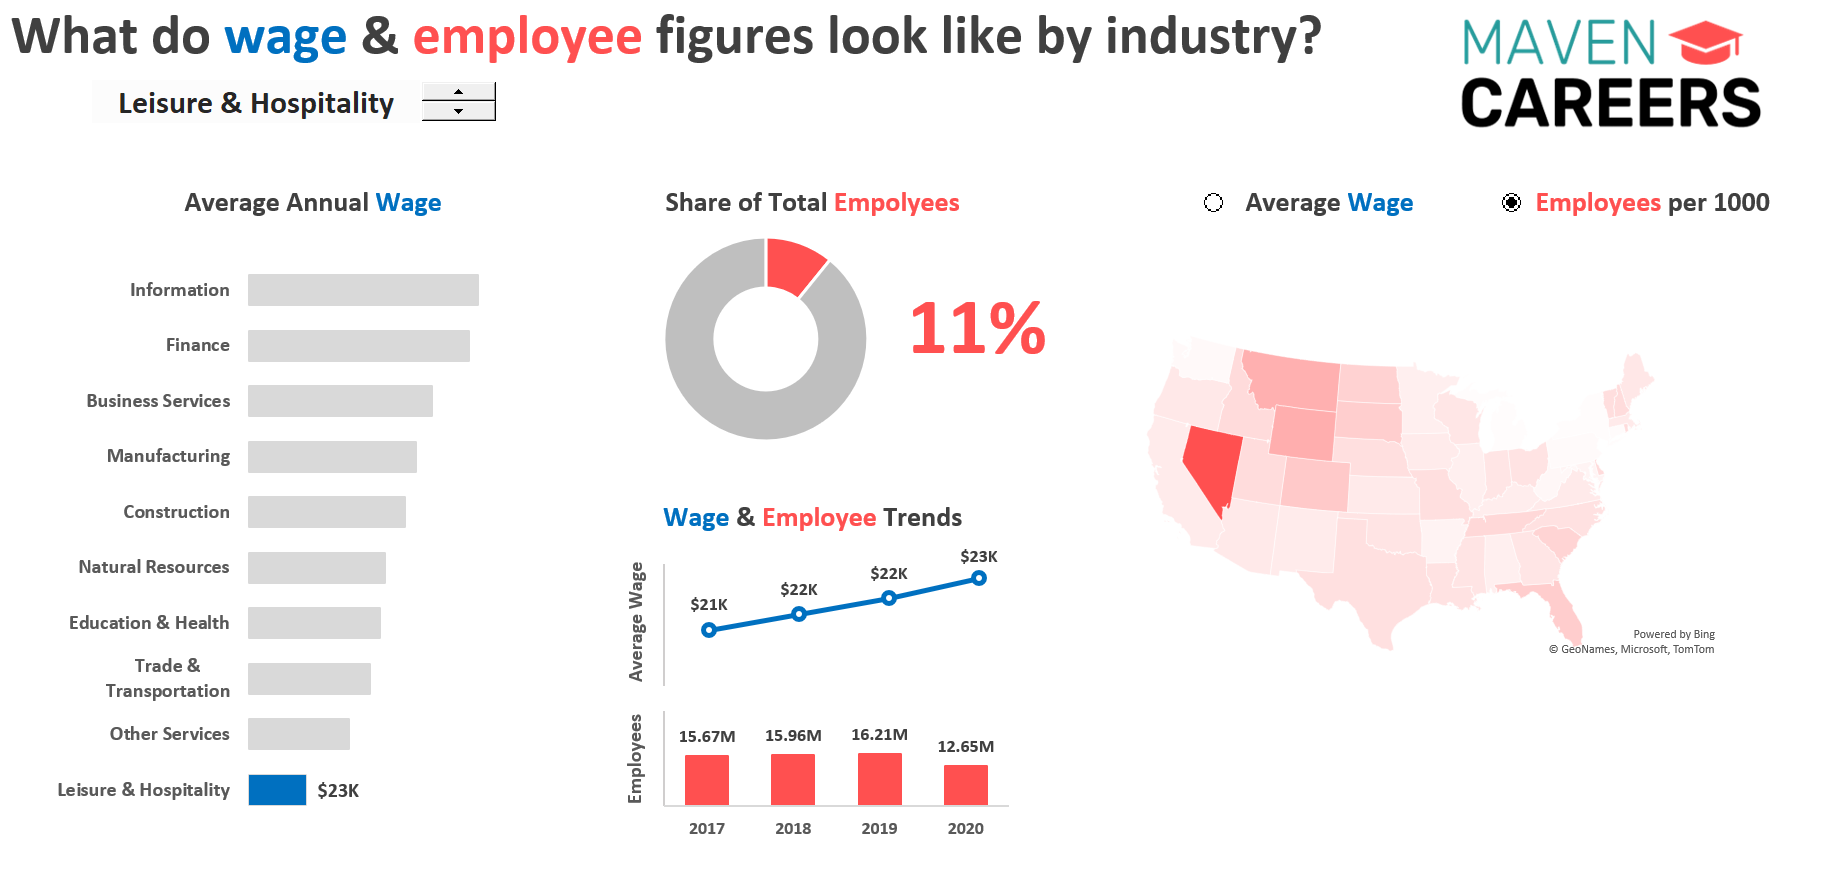
The project consists of US labour statistics data from 2017 to 2020. I created an excel dashboard that can be used to explore wage and employment trends and compare them across industries. Also, a map showing differences across states.
- Statistical & Lookup Formulas
- Inserting & Formatting Custom Charts
- Dynamically Highlighting Series
- Creating New Data with Data Types
- Adding Form Controls
- Protecting Workbooks & Worksheets
- Experiment with chart elements and layouts
- Usage of color and style intentionally
- Formatting options
- Understanding & usage of a secondary axis