Original dataset (found in Resources folder) which composed VBA Script was applied to has not been fully uploaded due to file size complications
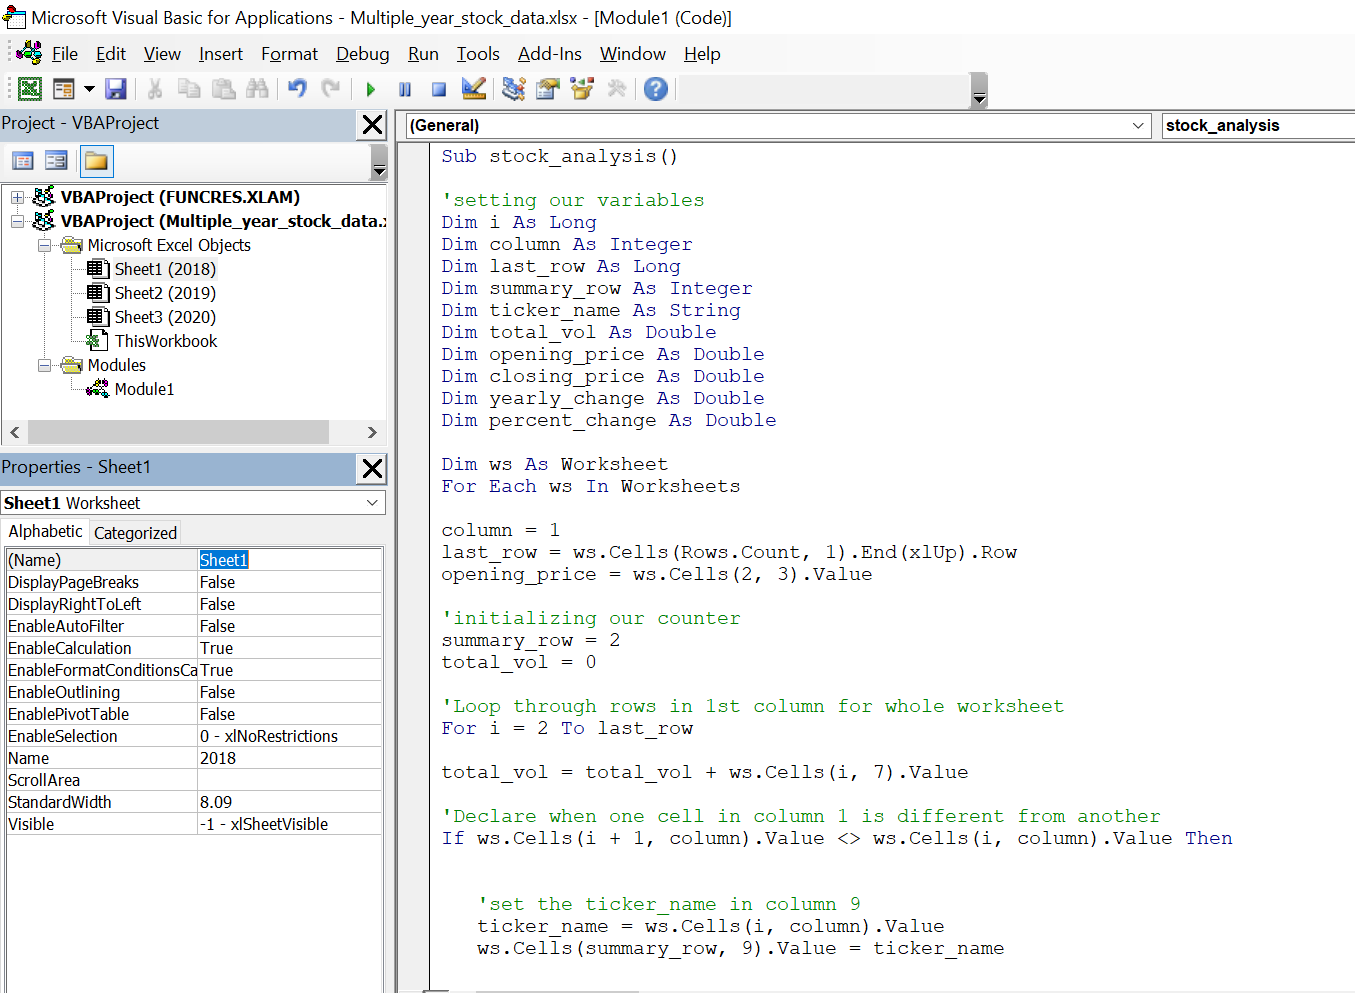
Create a script that loops through all the stocks for one year and outputs the following information:
-
The ticker symbol.
-
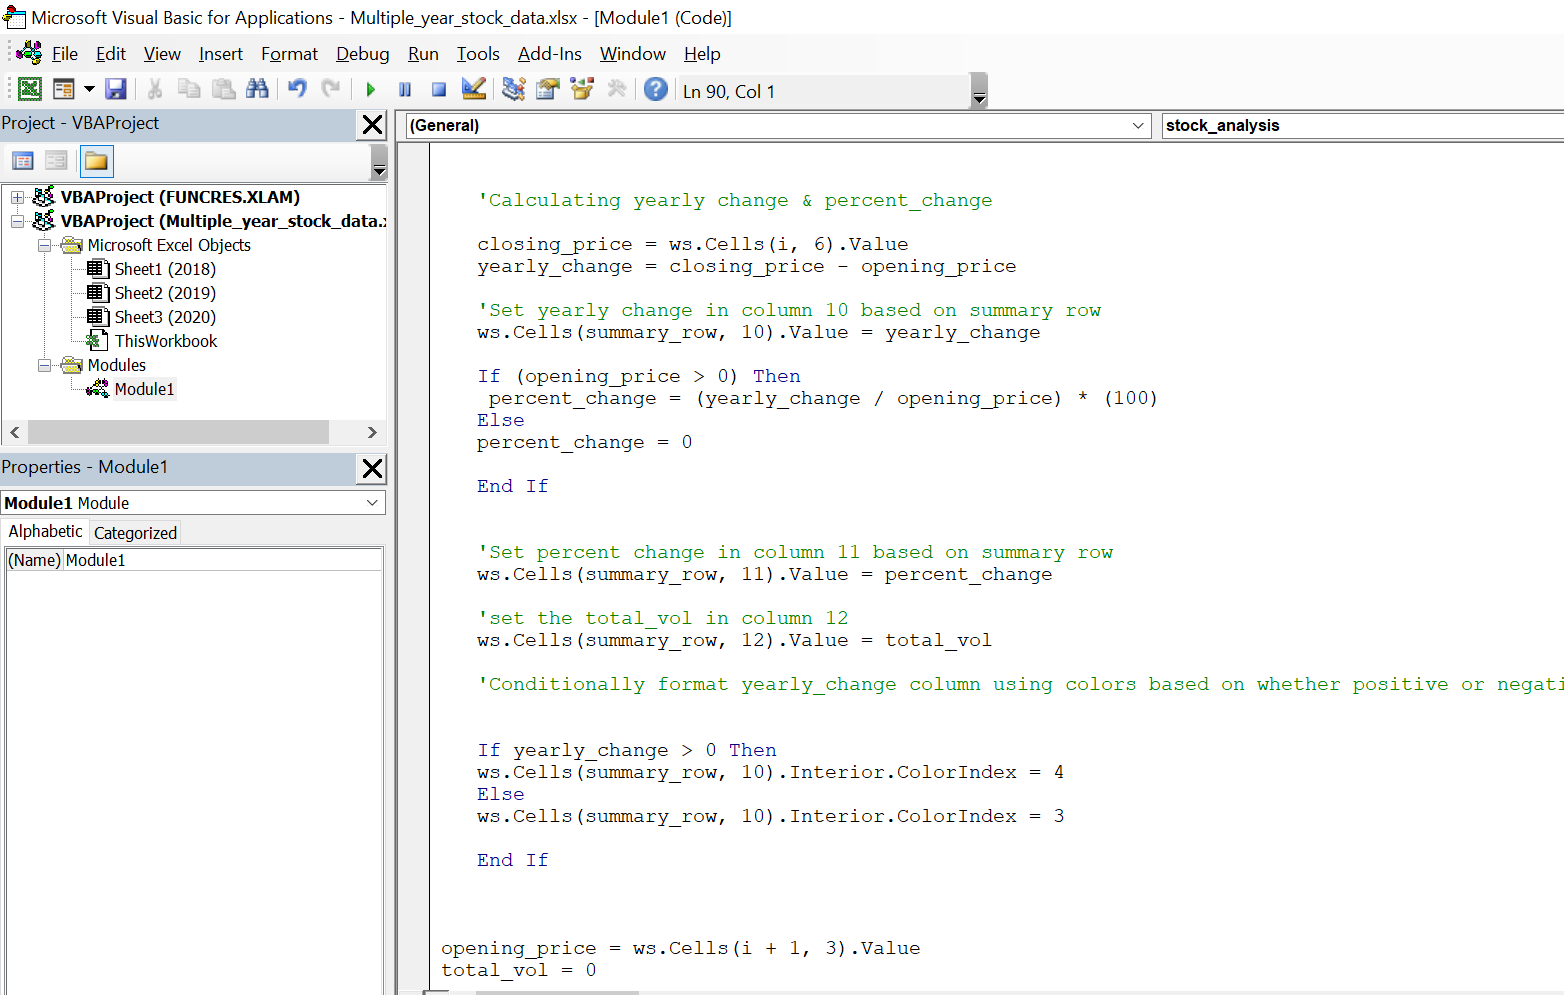
Yearly change from opening price at the beginning of a given year to the closing price at the end of that year.
-
The percent change from opening price at the beginning of a given year to the closing price at the end of that year.
-
The total stock volume of the stock.
Note: Make sure to use conditional formatting that will highlight positive change in green and negative change in red.
- Dataset generated by Trilogy Education Services, LLC.
© 2022 Trilogy Education Services, a 2U, Inc. brand. All Rights Reserved.