
Codeplot is an infinity canvas for data exploration.
Think of it as Figma, but for data teams.
Dive in, plot your data, and boost your productivity.
It’s data analysis without the scroll.
Your go-to tool for an amazing Exploratory Data Analysis workflow.
Created by @antl3x, read more about its inception.
Why Choose codeplot?
-
Dynamic Visualization: Break free from static images and rigid layouts. codeplot brings your data to life on an interactive canvas.
-
Easy Integration: Directly plot from your Python code or REPL into your canvas at codeplot.co.
-
Varied Visualizations: From basic charts to advanced widgets, codeplot supports a wide range of data representations.
-
Flexible Layouts: Arrange your visualizations to suit your workflow, with draggable and movable plots.
-
Open to Everyone: Designed for data scientists and enthusiasts alike, codeplot aims to enhance your data exploration experience.
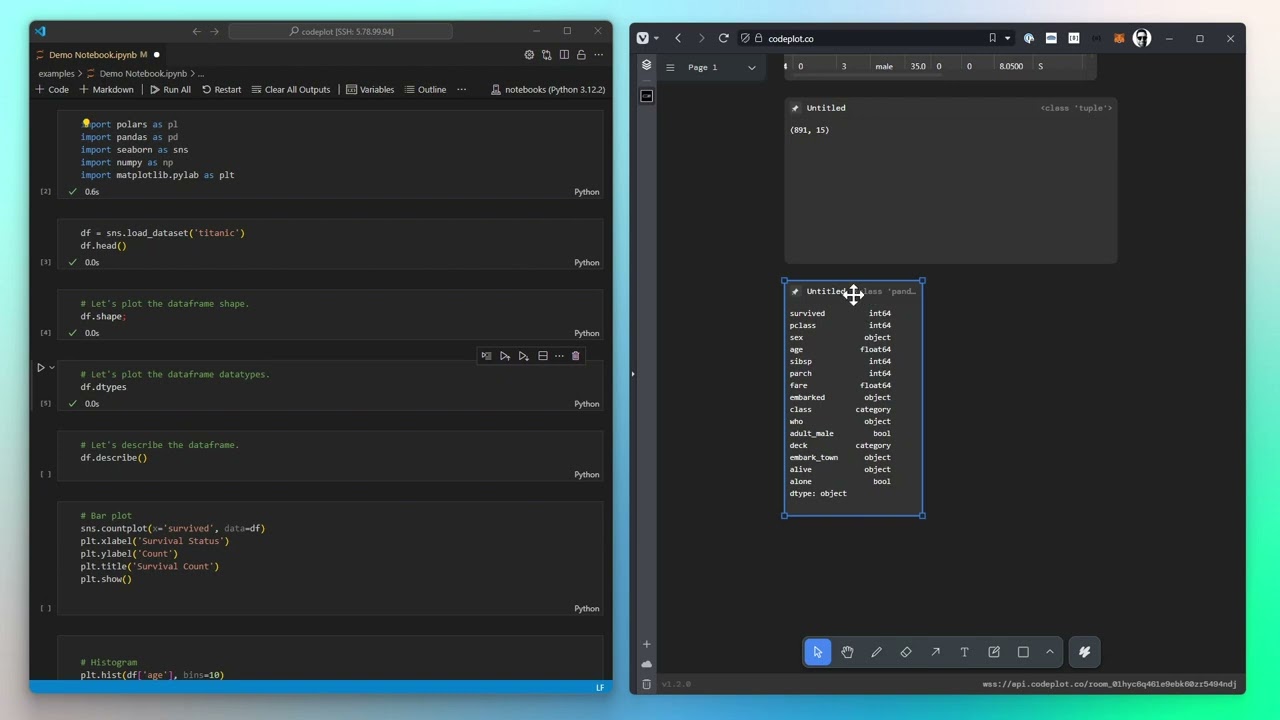
To use codeplot in a IPython environment like Jupyter, Google Colab, etc, you can install the IPython Extension using pip:
pip install codeplot-ipythonAfter install you can load the extension and connect to a new room:
%load_ext codeplot-ipython
%cP_connect ws://your-ws-url/your-room-id
Now the output of your cells will be automatically plotted in the codeplot canvas! So you don't need to use the cP.plot function.
Take a look at the Notebook Example
Thats all!
If you want to use codeplot in a Python script, and have a more "fine-grained" control over the plots, you can use the Python SDK.
To get started with codeplot, you can install the package using pip:
pip install codeplotOnce installed, you can start using codeplot by importing the package and connectig to a new room:
import asyncio
import codeplot

async def main():
    cP = await codeplot.connect("ws://your-ws-url/your-room-id")

    # Now you can start plotting
    await cP.plot(df.describe())
    await cP.plot(df.head(10))
    await cP.plot(df)

asyncio.run(main())
Take a look at the Notebook (SDK Example)
You can use the public codeplot client & server to start plotting right away:
- Join the codeplot room at codeplot.co
- Use the room id to connect to the room using the code above
Instead of using the public codeplot server, you can self-host and run codeplot on your local machine using Docker. To do so, you can use the following command:
curl -s https://raw.githubusercontent.com/codeplot-co/codeplot/master/minirepos/@codeplot-docker/docker-compose.yaml | docker-compose -f - upOr if you are using docker-compose v2, you can use the following command instead
curl -s https://raw.githubusercontent.com/codeplot-co/codeplot/master/minirepos/@codeplot-docker/docker-compose.yaml | docker compose -f - upThis will start a codeplot server and a client on your local machine, and you can access it at:
- Client: http://localhost:9107
- Server: ws://localhost:9108
Join the codeplot Community
Become part of a forward-thinking community dedicated to advancing data visualization. Connect, engage, and grow with peers on Discord. With codeplot, data visualization is a shared journey. Let's explore new insights together!
Codeplot is crafted to support a wide range of users, from individuals exploring their personal projects to enterprises seeking to enhance their business processes. To accommodate this diversity, Codeplot adopts a dual-license approach.
Codeplot is free to use for personal and non-commercial purposes.
Only pay if you use Codeplot commercially.
Read more about License and Pricing here.
This project is sponsored by LearnPolars.co. LearnPolars is a platform to learn data manipulation and analysis using Polars, a blazingly fast DataFrame library in Python (Rust).