-
Grafana Mimir is an open source, horizontally scalable, highly available, multi-tenant, long-term storage for Prometheus.
-
For information on Mimir, see the link below https://grafana.com/oss/mimir/
-
Jaeger is open source, end-to-end distributed tracing
-
For information on Jaeger, see the link below https://www.jaegertracing.io/
-
Loki is a log aggregation system designed to store and query logs from all your applications and infrastructure.
-
For information on Loki, see the link below https://grafana.com/oss/loki/
-
Before running docker compose, open /consul/mimir.json file and change all address configurations to your local IP.
-
Install Loki docker driver
docker plugin install grafana/loki-docker-driver:latest --alias loki --grant-all-permissions
- execute docker-compose
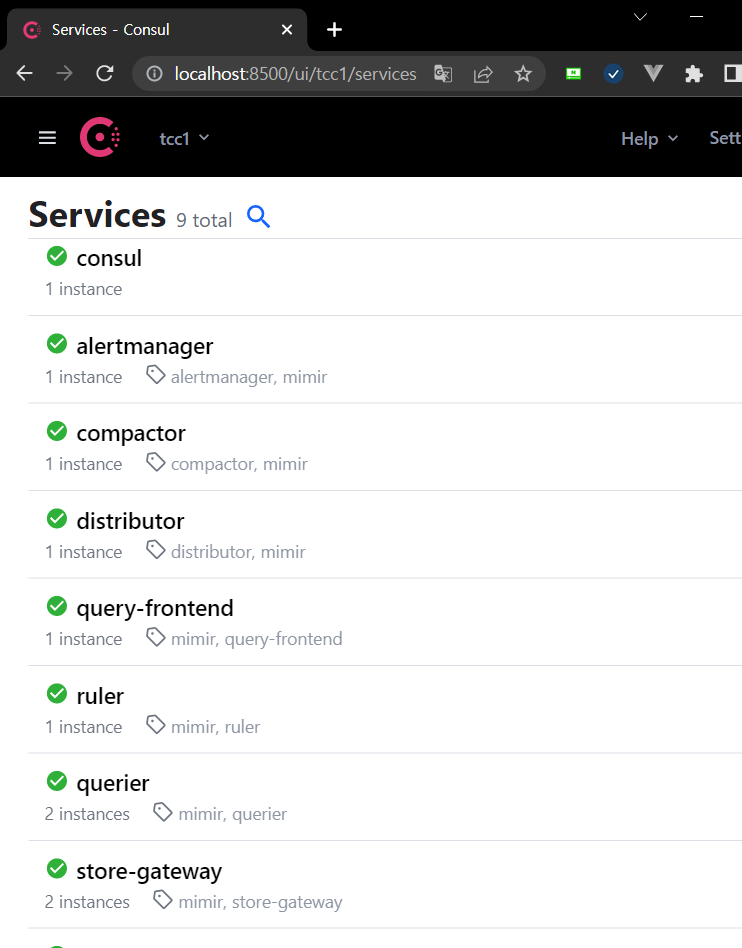
docker-compose up- Consul is health checking service components of Grafana Mimir MSA
- You can use Consul UI ai http://localhost:8500/
-
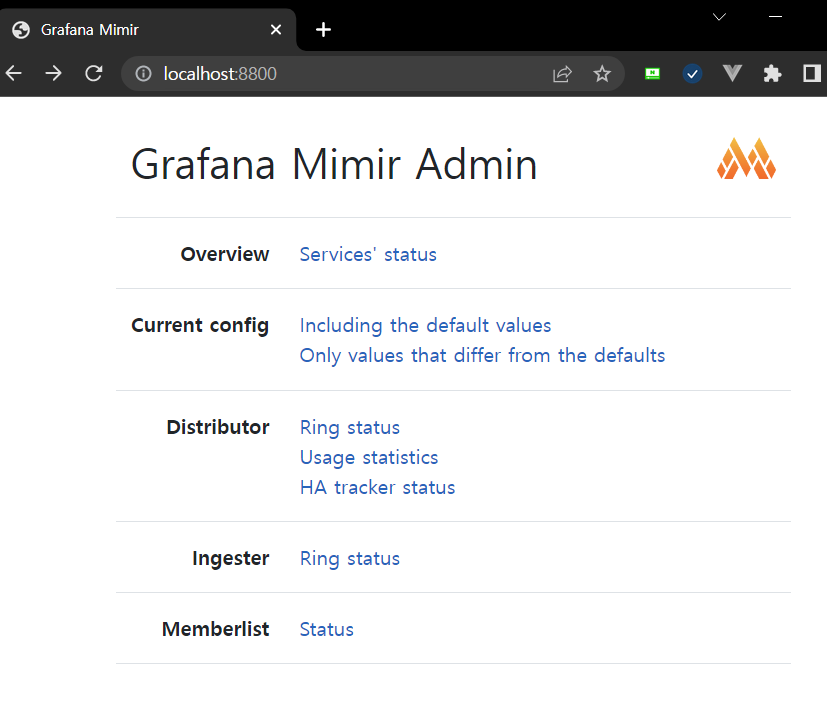
You can access Mimir distributor admin console at http://localhost:8800/
-
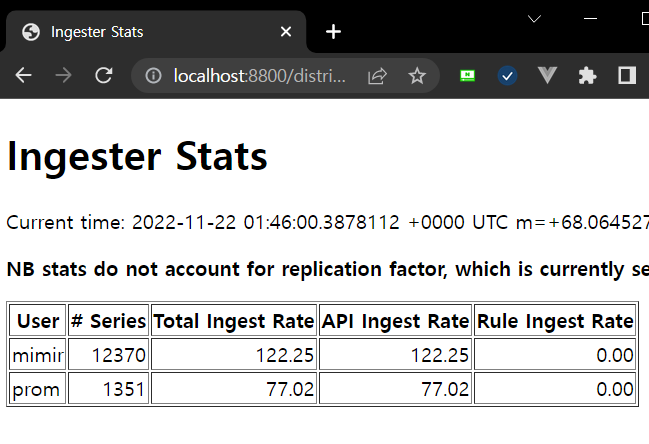
You can check remote writing metric targets Mimir admin console at http://localhost:8800/distributor/all_user_stats
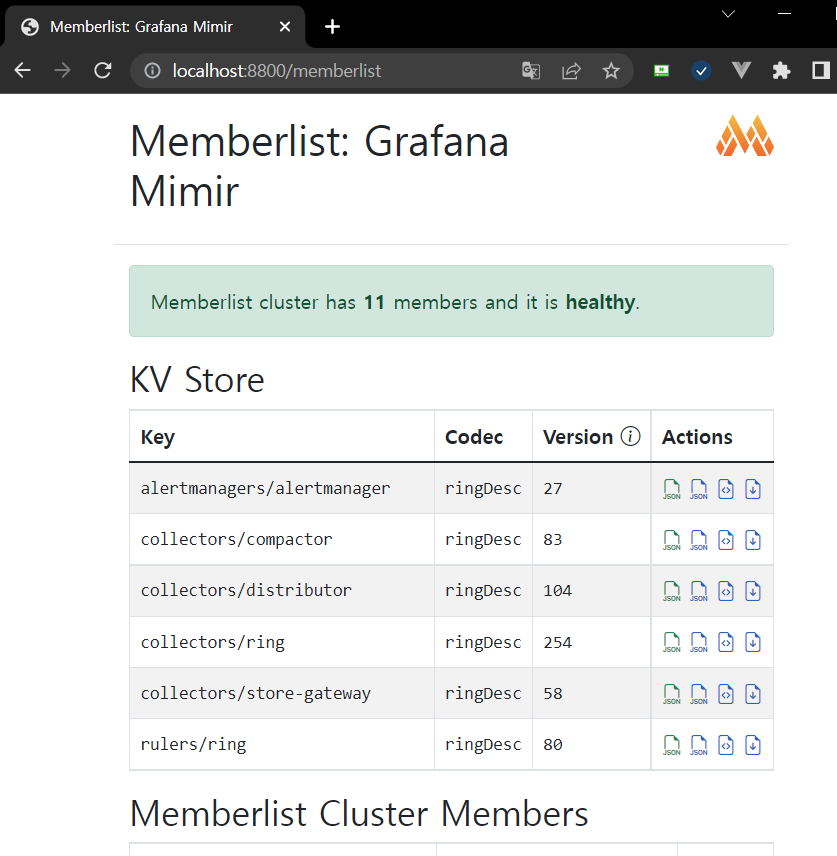
-
You can view the configuration services of Mimir MSA at http://localhost:8800/memberlist
-
Push prometheus metrics using endpoint http://localhost:8800/api/v1/push and X-Scope-OrgId http header
-
X-Scope-OrgId http header means tenant id, The tenant id identifies the target
-
You can see the metric names that can be checked with curl below
curl -i -X GET \
   -H "X-Scope-OrgId:tenant id" \
 'http://localhost:8880/api/prom/api/v1/metadata'
- If you know how to use prometheus promql, then You can query metrics data with the http request below.
curl -i -X GET \
   -H "X-Scope-OrgId:tenant id" \
 'http://localhost:8880/api/prom/api/v1/{promql}'
-
http://localhost:8880/api/prom is end point of Mimir query-frontend, add your promql query to it
-
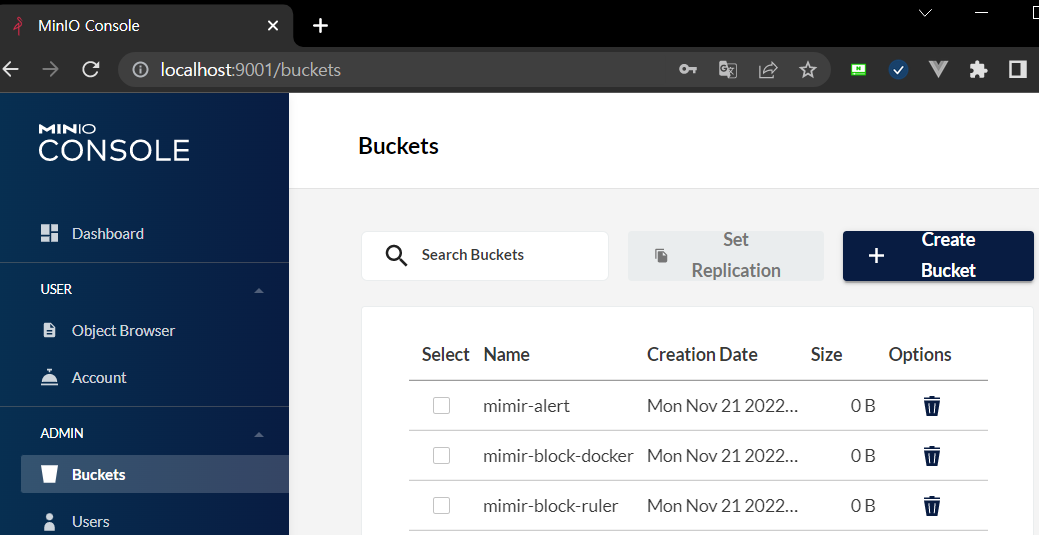
You can use minio ui at http://localhost:9001/
-
Log in with account, password minioadmin
-
mimir-block-docker bucket is storing metric data
-
You can see minio S3 buckets status
- Loki is collecting logs from docker logging driver and helps grafana visualize
- You can check the loki operation at http://localhost:3100/metrics
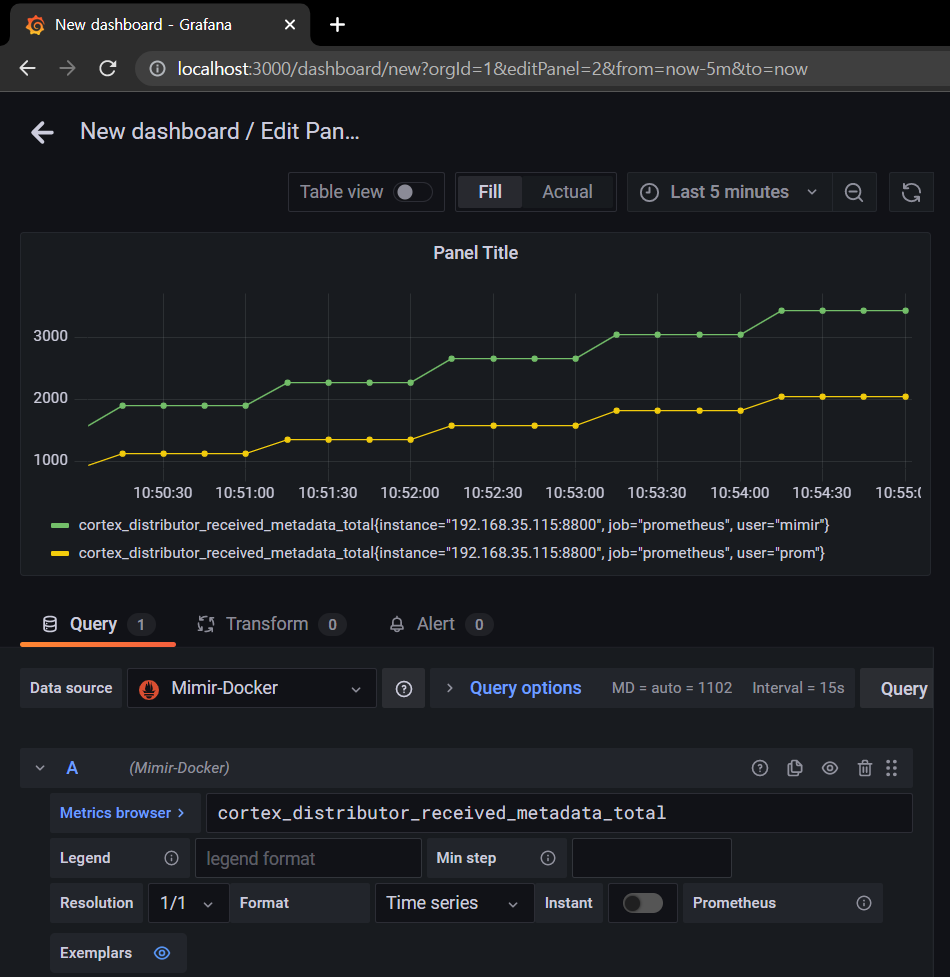
- Prometheus remotely writes collected metrics to Mimir Distributor Metrics data.
- You can use grafana ui at http://localhost:3000/
- Enter account and password admin
- When the grafana container starts up, it creates a prometheus datasource by reading datasources yml files
-
You can see spring application metric data sent by Mimir query-frontend and graphs
-
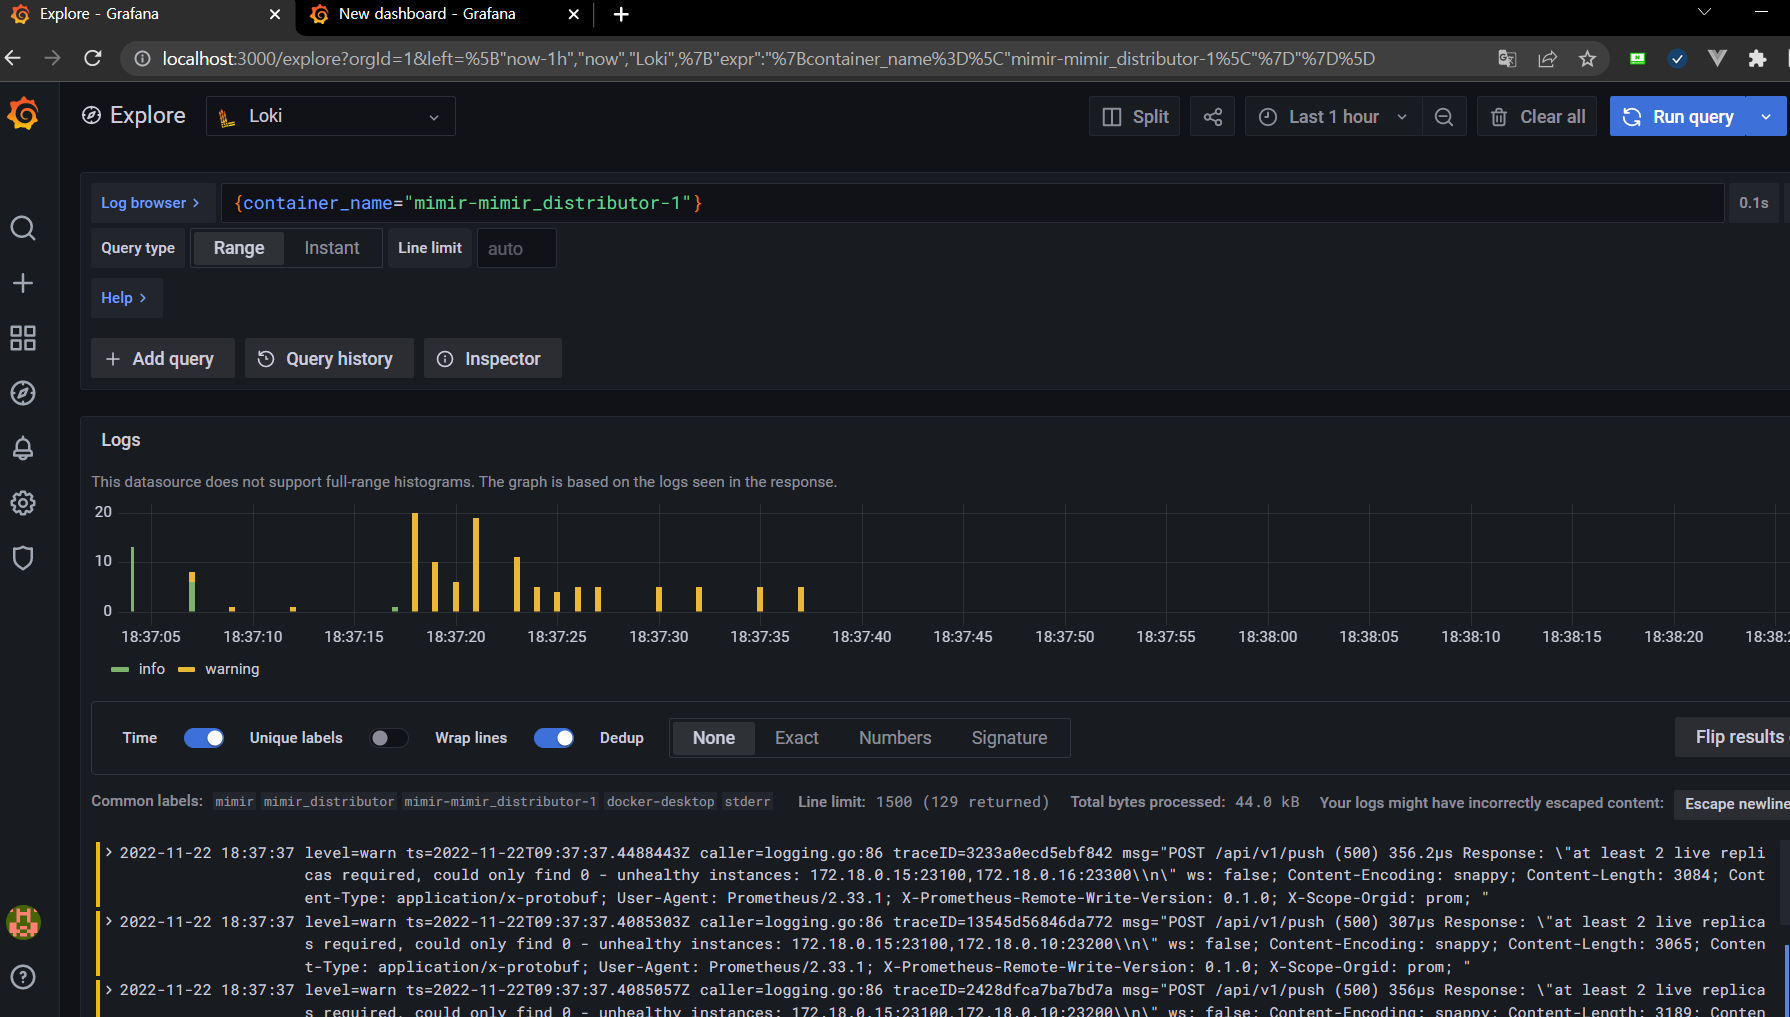
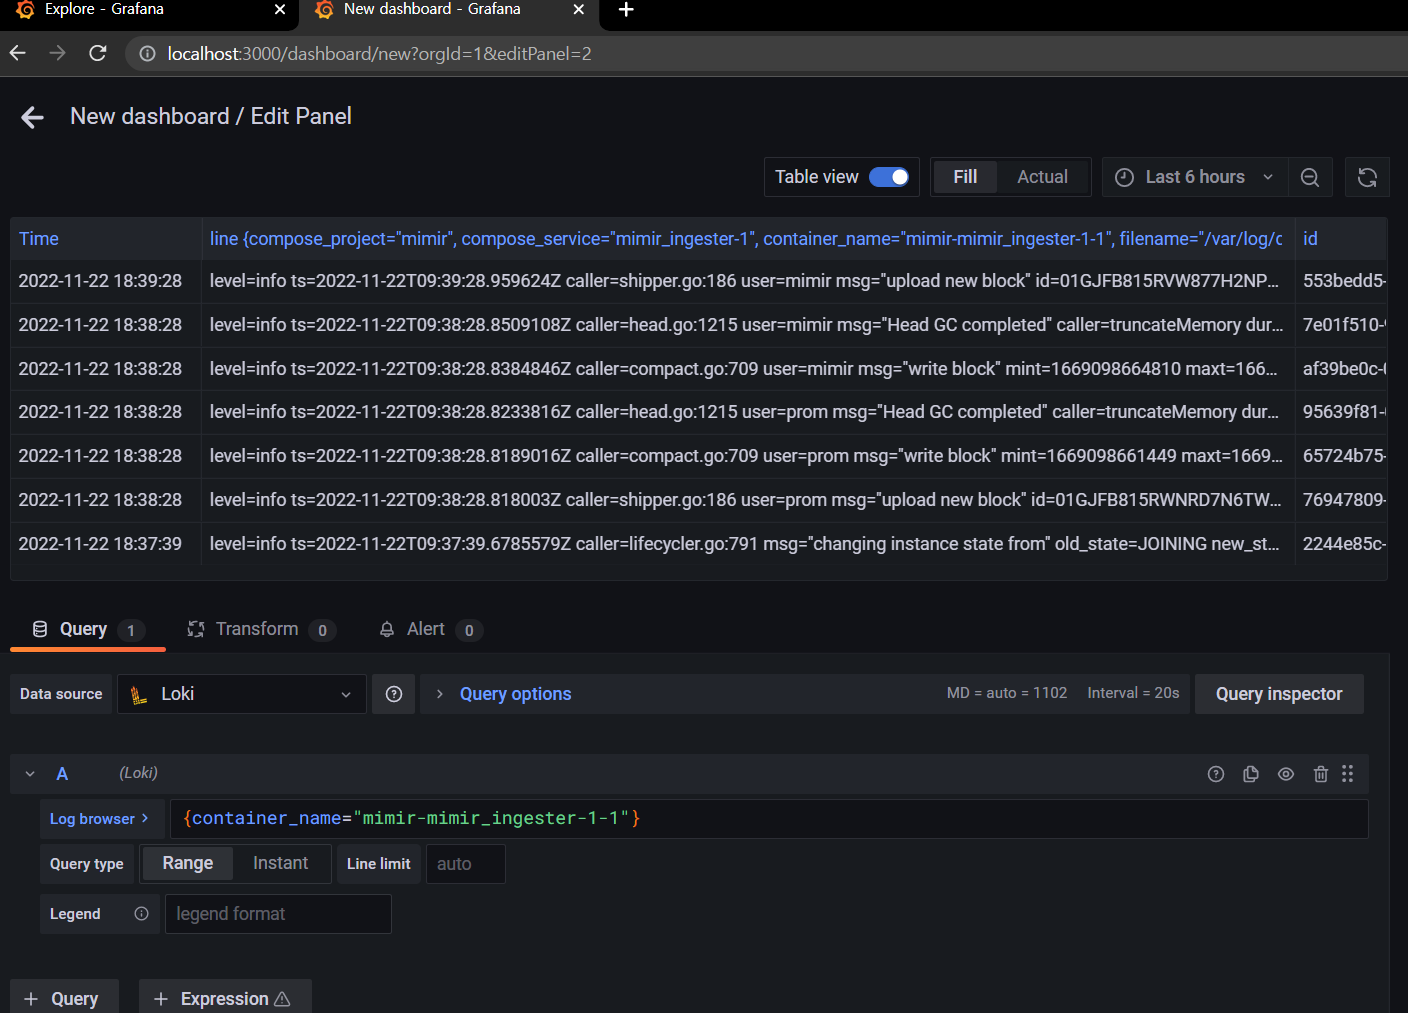
If you enter docker container name, You can see logs collected by Loki on grafana explore
-
You can see also logs on grafana dashboard
-
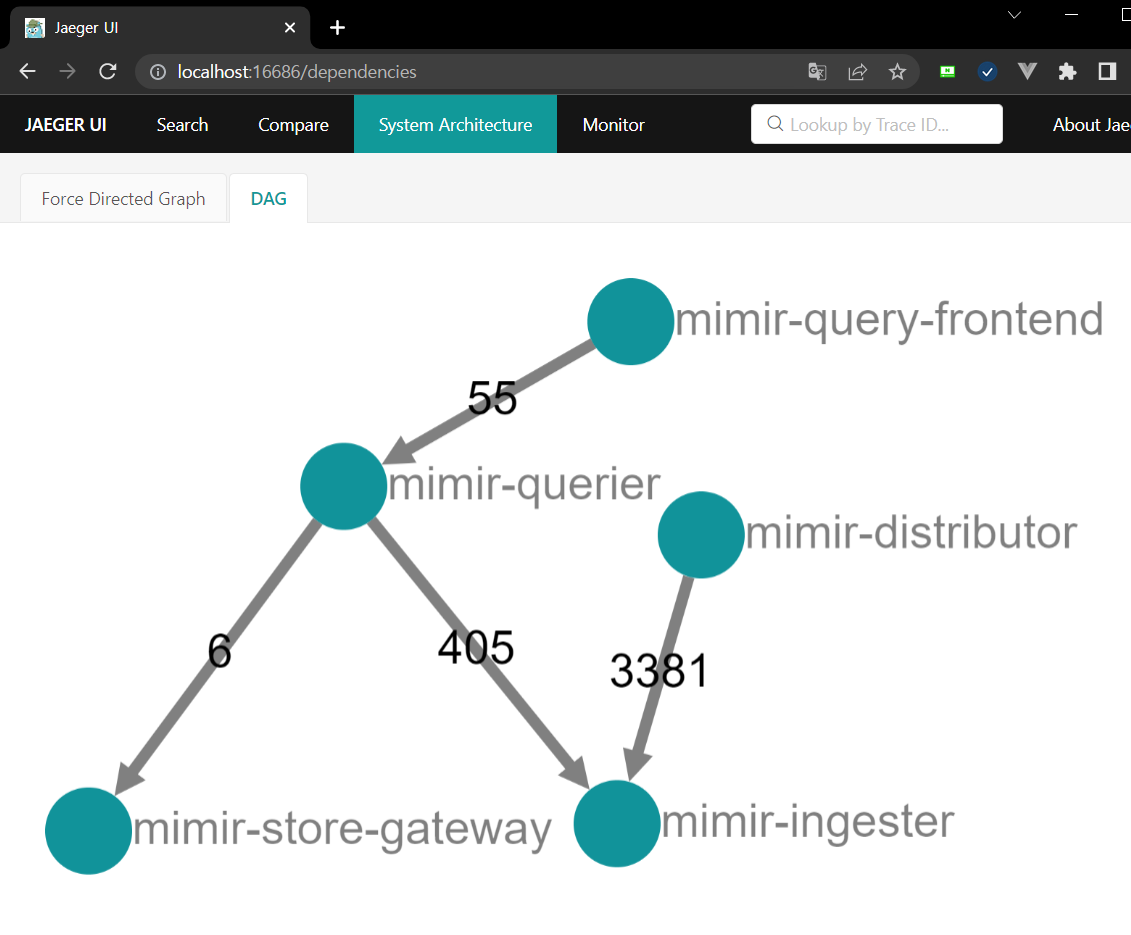
Each Mimir MSA Service send data to Jaeger through Jaeger Agent
-
You can search traces between Mimir MSA services at http://localhost:16686
-
You can see the structure of calls between Mimir MSA services