
Spark-Dashboard is a monitoring tool that collects Apache Spark metrics and displays them on a customizable Grafana dashboard for real-time performance tracking and optimization.
- You can find here all the components to deploy a monitoring application for Apache Spark
- Spark-Dashboard collects metrics from Spark and visualizes them in a Grafana
- This tool is intended for performance troubleshooting and DevOps monitoring of Spark workloads.
- Compatibility: Spark 2.4 and higher
- Architecture
- How To Deploy the Spark Dashboard V2
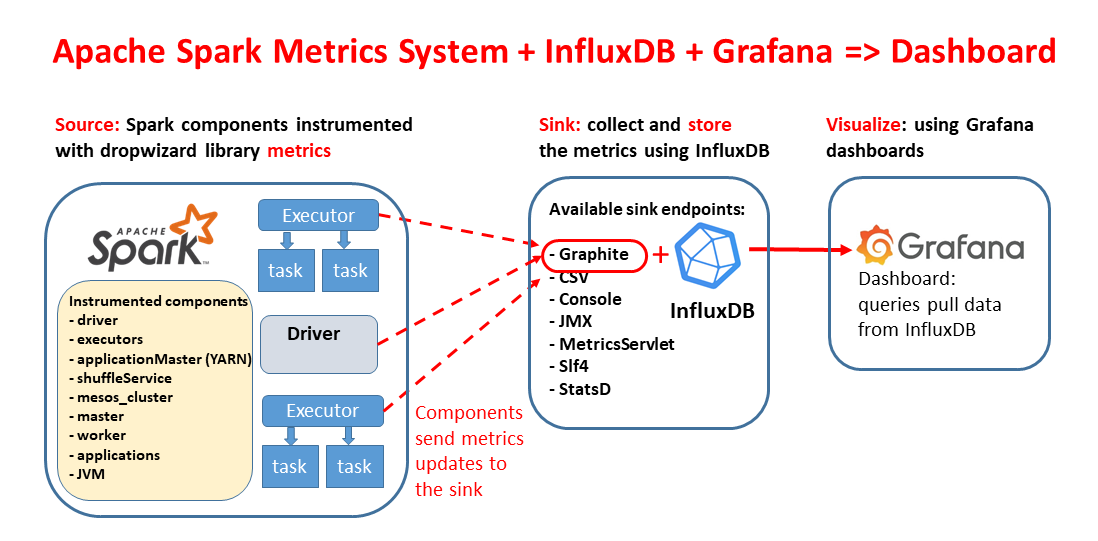
- Old implementation (V1)
- Advanced configurations and notes
Watch Spark-Dashboard demo and tutorial
- Notes on Spark Dashboard
- Blog on building an Apache Spark Performance Lab
- Blog on Spark Dashboard
- Talk on Spark performance at Data+AI Summit 2021, slides
- sparkMeasure a tool for performance troubleshooting of Apache Spark workloads
- TPCDS_PySpark a TPC-DS workload generator written in Python and designed to run at scale using Apache Spark
 Watch Spark-Dashboard demo and tutorial
Main author and contact: Luca.Canali@cern.ch

This technical drawing outlines an integrated monitoring pipeline for Apache Spark using open-source components. The flow of the diagram illustrates the following components and their interactions:
- Apache Spark's metrics: This is the source of metrics data: Spark metrics system. Spark's executors and the driver emit metrics such as executors' run time, CPU time, garbage collection (GC) time, memory usage, shuffle metrics, I/O metrics, and more. Spark metrics are exported in Graphite format by Spark and then ingested by Telegraf.
- Telegraf: This component acts as the metrics collection agent (the sink in this context). It receives the metrics emitted by Apache Spark's executors and driver, and it adds labels to the measurements to organize the data effectively. Telegraf send the measurements to VitoriaMetrics for storage and later querying.
- VictoriaMetrics: This is a time-series database that stores the labeled metrics data collected by Telegraf. The use of a time-series database is appropriate for storing and querying the type of data emitted by monitoring systems, which is often timestamped and sequential.
- Grafana: Finally, Grafana is used for visualization. It reads the metrics stored in VictoriaMetrics using PromQL/MetricsQL, which is a query language for time series data in Prometheus. Grafana provides dashboards that present the data in the form of metrics and graphs, offering insights into the performance and health of the Spark application.
Note: spark-dashboard v1 (the original implementation) uses InfluxDB as the time-series database, see also spark-dashabord v1 architecture
This quickstart guide outlines three methods for deploying Spark Dashboard:
- Recommended: Deploy Spark-Dashboard v2 on a container
- Deploy Spark-Dashboard v1 on a container
- Deploy Spark-Dashboard v1 on Helm
If you opt to deploy using a container image, follow these steps:
The provided container image has been built configured to run InfluxDB and Grafana
docker run -p 3000:3000 -p 2003:2003 -d lucacanali/spark-dashboard- The container runs also with podman:
podman run -p 3000:3000 -p 2003:2003 -d lucacanali/spark-dashboard - Note: port 2003 is for ingesting metrics with Telegraf using the Graphite protocol, port 3000 is the UI with Grafana dashboards
- More details, including how to persist metrics stored with VictoriaMetrics across container restarts, at: Spark dashboard in a container
You need to configure Spark to send the metrics to the desired Graphite endpoint + the add the related configuration.
You can do this by editing the file metrics.properties located in $SPARK_CONF_DIR as follows:
# Add this to metrics.properties
*.sink.graphite.host=localhost
*.sink.graphite.port=2003
*.sink.graphite.period=10
*.sink.graphite.unit=seconds
*.sink.graphite.prefix=lucatest
*.source.jvm.class=org.apache.spark.metrics.source.JvmSource
Additional configuration, that you should pass as command line options (or add to spark-defaults.conf):
--conf spark.metrics.staticSources.enabled=true
--conf spark.metrics.appStatusSource.enabled=true
Instead of using metrics.properties, you may prefer to use Spark configuration options directly. It's a matter of convenience and depends on your use case. This is an example of how to do it:
# VictoriaMetrics Graphite endpoint, point to the host where the VictoriaMetrics container is running
VICTORIAMETRICS_ENDPOINT=`hostname`

bin/spark-shell (or spark-submit or pyspark)
--conf "spark.metrics.conf.*.sink.graphite.class"="org.apache.spark.metrics.sink.GraphiteSink" \
--conf "spark.metrics.conf.*.sink.graphite.host"=$VICTORIAMETRICS_ENDPOINT \
--conf "spark.metrics.conf.*.sink.graphite.port"=2003 \
--conf "spark.metrics.conf.*.sink.graphite.period"=10 \
--conf "spark.metrics.conf.*.sink.graphite.unit"=seconds \
--conf "spark.metrics.conf.*.sink.graphite.prefix"="lucatest" \
--conf "spark.metrics.conf.*.source.jvm.class"="org.apache.spark.metrics.source.JvmSource" \
--conf "spark.metrics.staticSources.enabled"=true \
--conf "spark.metrics.appStatusSource.enabled"=true
Optional configuration if you want to collect and display "Tree Process Memory Details":
--conf spark.executor.processTreeMetrics.enabled=true
The dashboard provides visualization of the collected metrics:
- Summary of key metrics, as Run Time, CPU Time, I/O, Shuffle, number of tasks, and more.
- Timeseries graphs for the metrics collected by Spark.
How to use:
- Point your browser to
http://localhost:3000(editlocahostto point to your Grafana, as relevant) - Credentials: use the defaults for the first login (user: admin, password: admin)
- Use the default dashboard bundled with the container (Spark_Perf_Dashboard_v04_promQL) and select the username, applicationId and time range to display (default is last 5 minutes).
Notes:
- you will need a running Spark application configured to use the dashboard as detailed in point 1. and 2. to be able to select an application and display the metrics.
- For testing purposes, you can create load on Spark by using TPCDS_PySpark a TPC-DS workload generator written in Python and designed to run at scale using Apache Spark.
An extended Spark dashboard pipeline is available to collect and visualize OS and storage data. This utilizes Spark Plugins to collect the extended metrics. The metrics are collected and stored in the same VictoriaMetrics database as the Spark metrics.
-
The extended Spark dashboard has three additional groups of graphs compared to the "standard" SPark Dashboard:
- CGroup Metrics
- Relevant when running Spark on Kubernetes, as it uses CGroup instrumentation)
- Cloud Storage
- Relevant when using Spark with block storage: S3A, GZ, WASB, and cloud storage in general
- HDFS Advanced Statistics
- Provides additional metrics related to HDFS use, relevant when using Spark with HDFS
- CGroup Metrics
-
Configuration:
- Add the following to the Spark configuration:
--conf ch.cern.sparkmeasure:spark-plugins_2.12:0.3
--conf spark.plugins=ch.cern.HDFSMetrics,ch.cern.CgroupMetrics,ch.cern.CloudFSMetrics
- Add the following to the Spark configuration:
-
Use the extended dashboard
- Manually select the dashboard Spark_Perf_Dashboard_v04_PromQL_with_SparkPlugins
- The dashboard includes additional graphs for OS and storage metrics.
- You can use the TPCDS_PySpark package to generate a TPC-DS workload and test the dashboard.
- Run the following on local resources or cloud, for example use GitHub Codespaces from this repo
# Install the tool and dependencies
pip install pyspark
pip install sparkmeasure
pip install tpcds_pyspark

# Download the test data
wget https://sparkdltrigger.web.cern.ch/sparkdltrigger/TPCDS/tpcds_10.zip
unzip -q tpcds_10.zip

# 1. Run the tool for a minimal test
tpcds_pyspark_run.py -d tpcds_10 -n 1 -r 1 --queries q1,q2

# 2. Start the dashboard and visualize the metrics (use docker or podman)
docker run -p 2003:2003 -p 3000:3000 -d lucacanali/spark-dashboard

# 3. run the tpcds workload sending metrics to the dashboard
TPCDS_PYSPARK=`which tpcds_pyspark_run.py`
spark-submit --master local[*] \
--conf "spark.metrics.conf.*.sink.graphite.class"="org.apache.spark.metrics.sink.GraphiteSink" \
--conf "spark.metrics.conf.*.sink.graphite.host"="localhost" \
--conf "spark.metrics.conf.*.sink.graphite.port"=2003 \
--conf "spark.metrics.conf.*.sink.graphite.period"=10 \
--conf "spark.metrics.conf.*.sink.graphite.unit"=seconds \
--conf "spark.metrics.conf.*.sink.graphite.prefix"="lucatest" \
--conf "spark.metrics.conf.*.source.jvm.class"="org.apache.spark.metrics.source.JvmSource" \
--conf "spark.metrics.staticSources.enabled"=true \
--conf "spark.metrics.appStatusSource.enabled"=true \
--conf spark.driver.memory=4g \
--conf spark.log.level=error \
--packages ch.cern.sparkmeasure:spark-measure_2.12:0.24 \
$TPCDS_PYSPARK -d tpcds_10

# 4. Accessing the Grafana Dashboard:
#    - Navigate to https://localhost:3000 to access the Grafana dashboard.
#    - If using GitHub Codespaces, use the "Ports" tab to open a browser window for this address.
#    - Default credentials for Grafana are username: admin and password: admin.
#    - Optionally, open the Spark WebUI at http://localhost:4040 to monitor the Spark job.

# Wait a few minutes for metrics to populate the dashboard.
# Note: This dashboard is more effective when Spark runs on cluster resources
#       rather than in the local mode demonstrated here. For more details, refer to the next paragraph.
- Example of running TPCDS on a YARN Spark cluster, monitor with the Spark dashboard:
TPCDS_PYSPARK=`which tpcds_pyspark_run.py`

spark-submit --master yarn --conf spark.log.level=error --conf spark.executor.cores=8 --conf spark.executor.memory=64g \
--conf spark.driver.memory=16g --conf spark.driver.extraClassPath=tpcds_pyspark/spark-measure_2.12-0.24.jar \
--conf spark.dynamicAllocation.enabled=false --conf spark.executor.instances=32 --conf spark.sql.shuffle.partitions=512 \
$TPCDS_PYSPARK -d hdfs://<PATH>/tpcds_10000_parquet_1.13.1
- Example of running TPCDS on a Kubernetes cluster with S3 storage, monitor this with the extended dashboard using Spark plugins:
TPCDS_PYSPARK=`which tpcds_pyspark_run.py`

spark-submit --master k8s://https://xxx.xxx.xxx.xxx:6443 --conf spark.kubernetes.container.image=<URL>/spark:v3.5.1 --conf spark.kubernetes.namespace=xxx \
--conf spark.eventLog.enabled=false --conf spark.task.maxDirectResultSize=2000000000 --conf spark.shuffle.service.enabled=false --conf spark.executor.cores=8 --conf spark.executor.memory=32g --conf spark.driver.memory=4g \
--packages org.apache.hadoop:hadoop-aws:3.3.4,ch.cern.sparkmeasure:spark-measure_2.12:0.24,ch.cern.sparkmeasure:spark-plugins_2.12:0.3 --conf spark.plugins=ch.cern.HDFSMetrics,ch.cern.CgroupMetrics,ch.cern.CloudFSMetrics \
--conf spark.cernSparkPlugin.cloudFsName=s3a \
--conf spark.dynamicAllocation.enabled=false --conf spark.executor.instances=4 \
--conf spark.hadoop.fs.s3a.secret.key=$SECRET_KEY \
--conf spark.hadoop.fs.s3a.access.key=$ACCESS_KEY \
--conf spark.hadoop.fs.s3a.endpoint="https://s3.cern.ch" \
--conf spark.hadoop.fs.s3a.impl="org.apache.hadoop.fs.s3a.S3AFileSystem" \
--conf spark.executor.metrics.fileSystemSchemes="file,hdfs,s3a" \
--conf spark.hadoop.fs.s3a.fast.upload=true \
--conf spark.hadoop.fs.s3a.path.style.access=true \
--conf spark.hadoop.fs.s3a.list.version=1 \
$TPCDS_PYSPARK -d s3a://luca/tpcds_100
This is the original implementation of the tool using InfluxDB and Grafana
1. Start the container
The provided container image has been built configured to run InfluxDB and Grafana
-docker run -p 3000:3000 -p 2003:2003 -d lucacanali/spark-dashboard:v01
- Note: port 2003 is for Graphite ingestion, port 3000 is for Grafana
- More options, including on how to persist InfluxDB data across restarts at: Spark dashboard in a container
2. Spark configuration See above
3. Visualize the metrics using a Grafana dashboard
- Point your browser to
http://hostname:3000(edithostnameas relevant) - See details above
If you chose to run on Kubernetes, these are steps:
-
The Helm chart takes care of configuring and running InfluxDB and Grafana:
- Quickstart:
helm install spark-dashboard https://github.com/cerndb/spark-dashboard/raw/master/charts/spark-dashboard-0.3.0.tgz - Details: charts
- Quickstart:
-
Spark configuration:
- Configure
metrics.propertiesas detailed above. - Use
INFLUXDB_ENDPOINT=spark-dashboard-influx.default.svc.cluster.localas the InfluxDB endpoint in the Spark configuration.
- Configure
-
Grafana's visualization with Helm:
- The Grafana dashboard is reachable at port 3000 of the spark-dashboard-service.
- See service details:
kubectl get service spark-dashboard-grafana - When using NodePort and an internal cluster IP address, this is how you can port forward to the service from
the local machine:
kubectl port-forward service/spark-dashboard-grafana 3000:3000
More info at Spark dashboard on Kubernetes
Optionally, you can add annotation instrumentation to the performance dashboard v1. Annotations provide additional info on start and end times for queries, jobs and stages. To activate annotations, add the following additional configuration, needed for collecting and writing extra performance data:
INFLUXDB_HTTP_ENDPOINT="http://`hostname`:8086"
--packages ch.cern.sparkmeasure:spark-measure_2.12:0.24 \
--conf spark.sparkmeasure.influxdbURL=$INFLUXDB_HTTP_ENDPOINT \
--conf spark.extraListeners=ch.cern.sparkmeasure.InfluxDBSink \
- More details on how this works and alternative configurations at Spark Dashboard
- The dashboard can be used when running Spark on a cluster (Kubernetes, YARN, Standalone) or in local mode.
- When using Spark in local mode, use Spark version 3.1 or higher, see SPARK-31711
- Telegraf will use port 2003 (graphite endpoint) and port 8428 (VictoriaMetrics source) of your machine/VM.
- For dashboard v1: InfluxDB will use port 2003 (graphite endpoint), and port 8086 (http endpoint) of
your machine/VM (when running using
--network=host). - Note: the endpoints need to be available on the node where you started the container and reachable by Spark executors and driver (mind the firewall).
- Find the InfluxDB endpoint IP with
kubectl get service spark-dashboard-influx. - Optionally, resolve the DNS name with
nslookupof such IP. For example, the InfluxDB service host name of a test installation is:spark-dashboard-influx.default.svc.cluster.local
- This implementation comes with some example dashboards. Note that only a subset of the metrics values logged into VictoriaMetrics are visualized in the provided dashboard.
- For a full list of the available metrics see the documentation of Spark metrics system.
- New dashboards can be added by putting them in the relevant
grafana_dashboardsfolder and re-building the container image (or re-packaging the helm chart). - On Helm: running helm-update is enough to upload it as ConfigMap and make it available to Grafana.
- Automatically persisting manual edits is not supported at this time.