This is a project designed to make predictions based on forex data. It will make use of neural networks to categorise a data pattern as either an opportunity to buy a currency, or sell. The inputs will be a series of open-high-low-close (ohlc) data points, the time width and the number of which will be configurable in order to try and find the best patterns. The outputs will be a classification of buy or sell within a certain timeframe, again this will be configurable to find the best fit.
The project will not provide particularly accurate predictions as the data is generally random. It is known that certain traders use patterns to gain an indication of whether to buy/sell and form a strategy that gives them a very slight edge that pays off over the long run. This is the intention of the project, and success will be defined as gaining average trade profit that exceeds the buy-spread set by common brokers.
Data provided for training, test and validation is downloaded from https://www.histdata.com/ The ascii format will create csv files which are merged and their datetimes reformatted to adhere to more common conventions.
Clone the repo:
git clone https://gitlab.com/aworrall2512/forex-predictor.git
Using the library virtual env (version 20.0.31 at the time of writing), create a new virtual environment
pip install virtualenv
virtualenv .venv
Add the root path to the generated file .venv/Lib/site-packages/_virtual_env.py, below the imports add
sys.path.append('path\\to\\project\\ForexPredictor')This will allow the standard relative imports to work when running any scripts from the root directory (useful when working as a VS Code project)
Create a file called data under the root folder and place the csv files in here. Files need to be formatted with the 3 letter market code separated by an underscore. For example, the market GBP/USD would be saved as data/GBP_USD.csv. This will act as the raw data file and won't be committed.
This data must be formatted as inputs and outputs for consumption by our models. The inputs simply become the difference of each of the price values compared to the opening price of the first interval in the row. The last two values in the row are the 'outputs' and are the opening and closing values of the target interval. These are preserved at this stage rather than categorised because they prove useful in later analysis.
The scripts to do this can be found in the forex_predictor/data_extraction folder. All that needs to be modified is the bottom of the current_processing_script.py which is where input intervals and the target interval can be specified along with the market, date range, dataset name and batch size.
The batch size is editable because performance differs depending on the interval sizes. Batching was introduced because the lookup of dates in an extremely large dataframe proved to be computationally expensive and used up significant amounts of memory. It takes a little while to construct the smaller 'batch' dataframe but iterating over it and performing calculations is much quicker. Therefore you should pick a batch size that has a happy tradeoff between time spent identifying new dataframes and time spend performing calculations. Current timings have shown this tends to be optimal between the 20000-30000 range for models constructed so far.
Once completed successfully, a folder called models will be automatically generated under the root folder. Under here, there will be a folder matching the specified name and this will currently only contain one sub folder called data. In here are the consumable csv files for training, validating and back testing the models. This can take several hours even on a powerful machine so it is worth creating multiple dataformats and running them all overnight.
Most of the methods involved in the script have corresponding unit tests. These are maintained under the root folder in a folder named test and use Python's unittest module.
The scripts for this are under forex_predictor/train_validate_test_predictors. Each model has its own folder which follows a specific layout. If creating a new model, it is recommended to use the existing models as a template and update the file paths in each file to match the model (by convention also the folder) name. The test data that is being operated on should be specified at the top and match the name in the data extraction scripts.
The first script to run is the train_classifier.py script. This will train the model and save any assets related to it under models/{DATASET_NAME}/{MODEL_NAME}. The folder name for the assets varies depending on the library used. Some older templates may also output basic evaluation metrics in the logs which may be useful in quickly identifying bad models but are often misleading.
The next script to run is the pre_analysis.py script. This should be edited to configure sensitivity of our buy/sell decisions based on model confidence. It consumes the testing.csv data generated and creates a file with the buy/sell decision made against every row vs actual outputs.
Finally, the analysis.py script displays stats and charts about the model and how it would have performed against the test data. There are options to filter the base_data by certain attributes and display output summaries / charts against a fictional starting sum.
The below images demonstrate an output from a model generated from an artificial neural network. It shows some early promise but areas of concern. The blue line assumes that all trades can be made with an equal buy/sell price. This is unrealistic as any broker will not have an even bid-ask price (offer you lower prices when you sell and higher prices when you buy). The wealth curve for a bid-ask price of 2 pips is captured by the red line. Finally the green line shows what results can be achieved by utilising a leverage of 10 times.
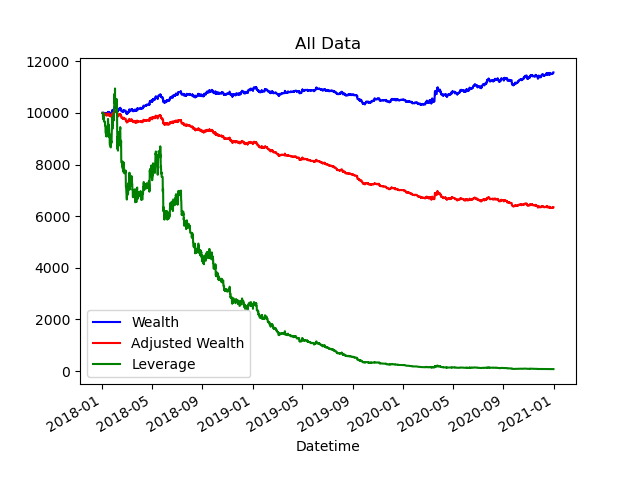
Figure 1a. Timeseries data showing how making trades based on the model affects an initial investment of £10 000 on the test data
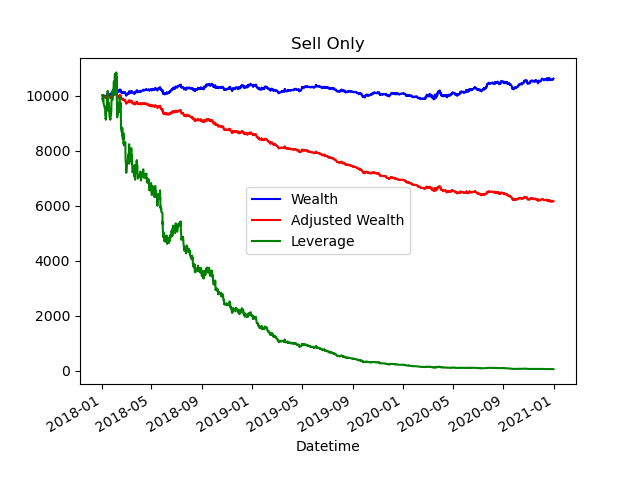
Figure 1b. Same data as figure 1a but only acting on the sell decisions from the model
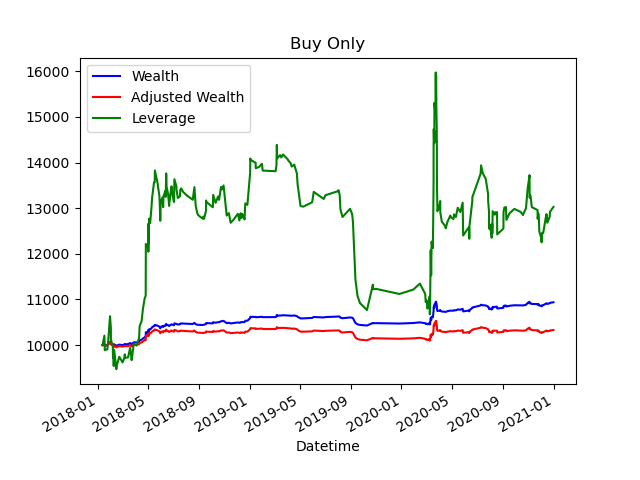
Figure 1b. Same data as figure 1c but only acting on the buy decisions from the model