DashVis is an open-source Dashboard built with Rails for all users in general. DashVis can be used to organize your resources via Tables (For exampe, Notepad, Contacts, Playlist, etc.)and Folders (For example, Entertainment, Studies, etc.). Feel free to use the live website and take the help of the User's manual.
- What is DashVis?
- Is DashVis like Google Sheets?
- How to use DashVis?
- Pro ways to use DashVis
- Why is it named DashVis anyway?
- Roadmap
- License
Having surfed on the internet for so long, I came to see multiple web applications that handle a single (specific) type of tabular data - Passwords, Wallets, Bookmarks, Notepads, To-Dos, Playlist and what not! Rather, why not have a single web application that provides the user with the power to manipulate tabular data as they wish?
This lead to inception of DashVis, and is exactly what DashVis stands for - to provide users with power of managing their data at a single place.
Yes and No.
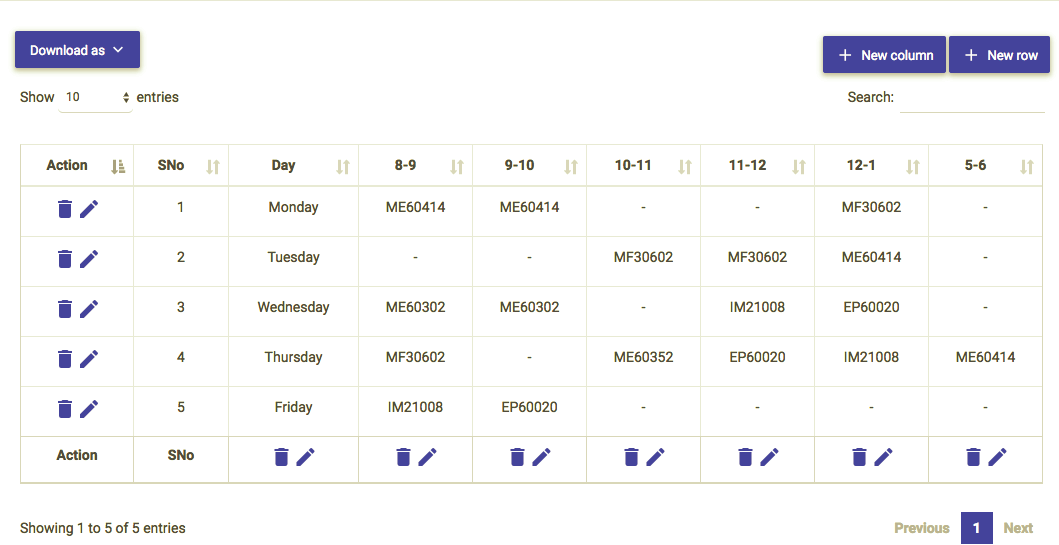
Google Sheets is an online way of doing Excel Spreadsheets. Excel Spreadsheets are more inclined for performing calculations and for commercial usage. DashVis tries to mix the traditional CRUD functionality like Google Sheets along with a Dashboard interface (like the stand-alone applications). With a tabular interface, searching and organizing resources is easier.
That being said, DashVis is still at it's infancy right now. There are lots of potential features that can still be incorporated into DashVis. Have a look at the Roadmap or Issue tracker for more details.
- Login with your social media accout (Google, Facebook, LinkedIn or GitHub)
- You'll see that there are 2 segregations :
TablesandFolders.Tables: These are your individual tables, such asBooks,YouTubers,Wallet,Policies.Folders: These are your folders / table-tags, such asEntertainment,Finance,2018, etc.- NOTE : A folder can contain multiple tables. Similarly, a table can also belong to multiple folders.
- Create new
Tables, newFoldersand add your specific tables to each collection (as you prefer). - Search for your
TablesandFoldersin the dashboard. - Find DashVis useful? Share it with your friends.
Flavouring the tabular data with a little bit of HTML tags can add a zing to your viewing experience. For example,
- Add Hyperink to open in new tab :
<a href="https://enter/the/url.here" target="_blank">Link text</a> - Add Image :
<img src="https://path/to/image.jpg" width="100" height="100">
-
Dashis short for Dashboard. -
Visis short for Visualization.- Currently, only tabular visualization is supported. However, support for different types of charts is coming soon.
-
DashVisremotely spells and sounds like Jarvis.
- Tables : Create, Update and Delete functionalities for Rows and Columns.
- Folders : Create, Update and Delete functionalities.
- Custom Table Template : Create, Update and Delete functionalities.
- Ability to share Tables / Folders, with Public / specific user, with specific access level (read, write or admin).
- Charts : Create, Update and Delete functionalities.
- Optimize application to reload only specific parts of website with AJAX.
- Support scrapers to feed real-time data into a specific Table.
- Table-wise timelines
The MIT License 2018 Athitya Kumar. For more details, have a look at the License.
MOST IMPORTANT CONDITION: If you're planning to modify and use this codebase for any commercial applications, kindly shoot a mail to athityakumar@gmail.com and get my approval before using the codebase.