This quickstart, for the most part, consists of two of Hasura's microservices:
-
quandl: Fetches and stores data from Quandl and stores them in Hasura's Postgres database.
-
Jupyter: Runs Jupyter with a notebook running on R kernel, comes with necessary packages installed for building, analysing and visualising models interactively.
Follow along below to get the setup working on your cluster and also to understand how this quickstart works.
Click the Clone & Deploy button and follow the steps mentioned to get started quickly.
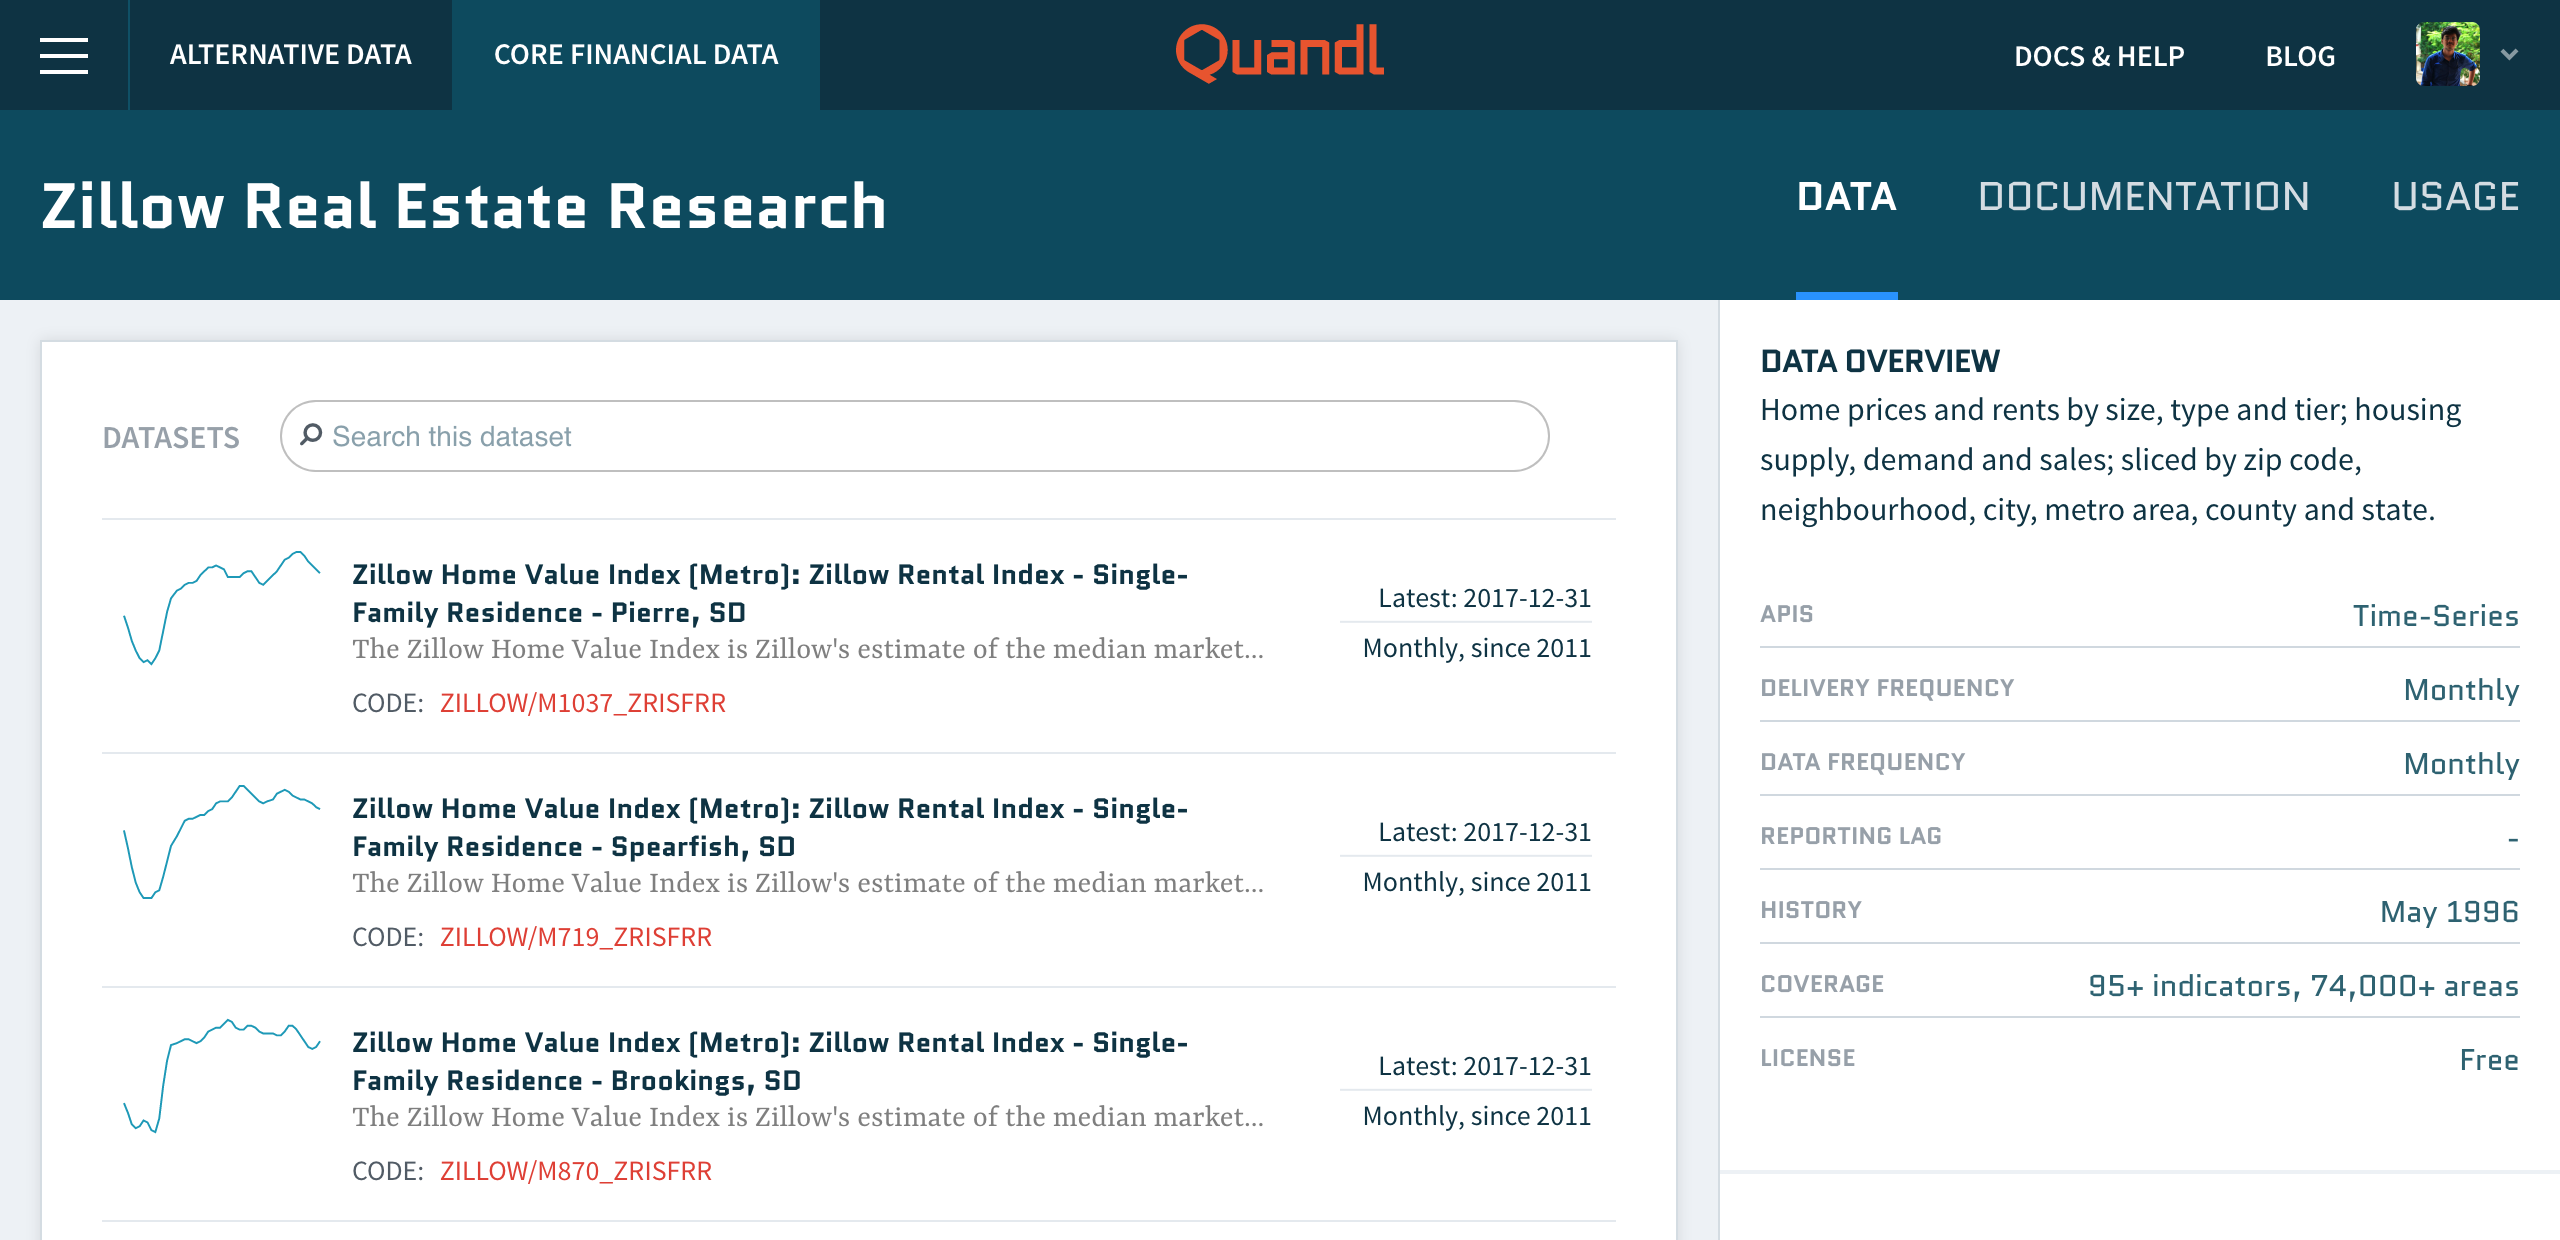
Before you begin, head over to Quandl, create an account, and select the dataset you would like to use. In this case, we are going with the Zillow Real Estate Research dataset.
Keep in mind the quandl_code (In this case it is, ZILLOW/M1037_ZRISFRR) for this dataset.
To fetch the data you need to have an API Key which you can get by getting an account with Quandl.
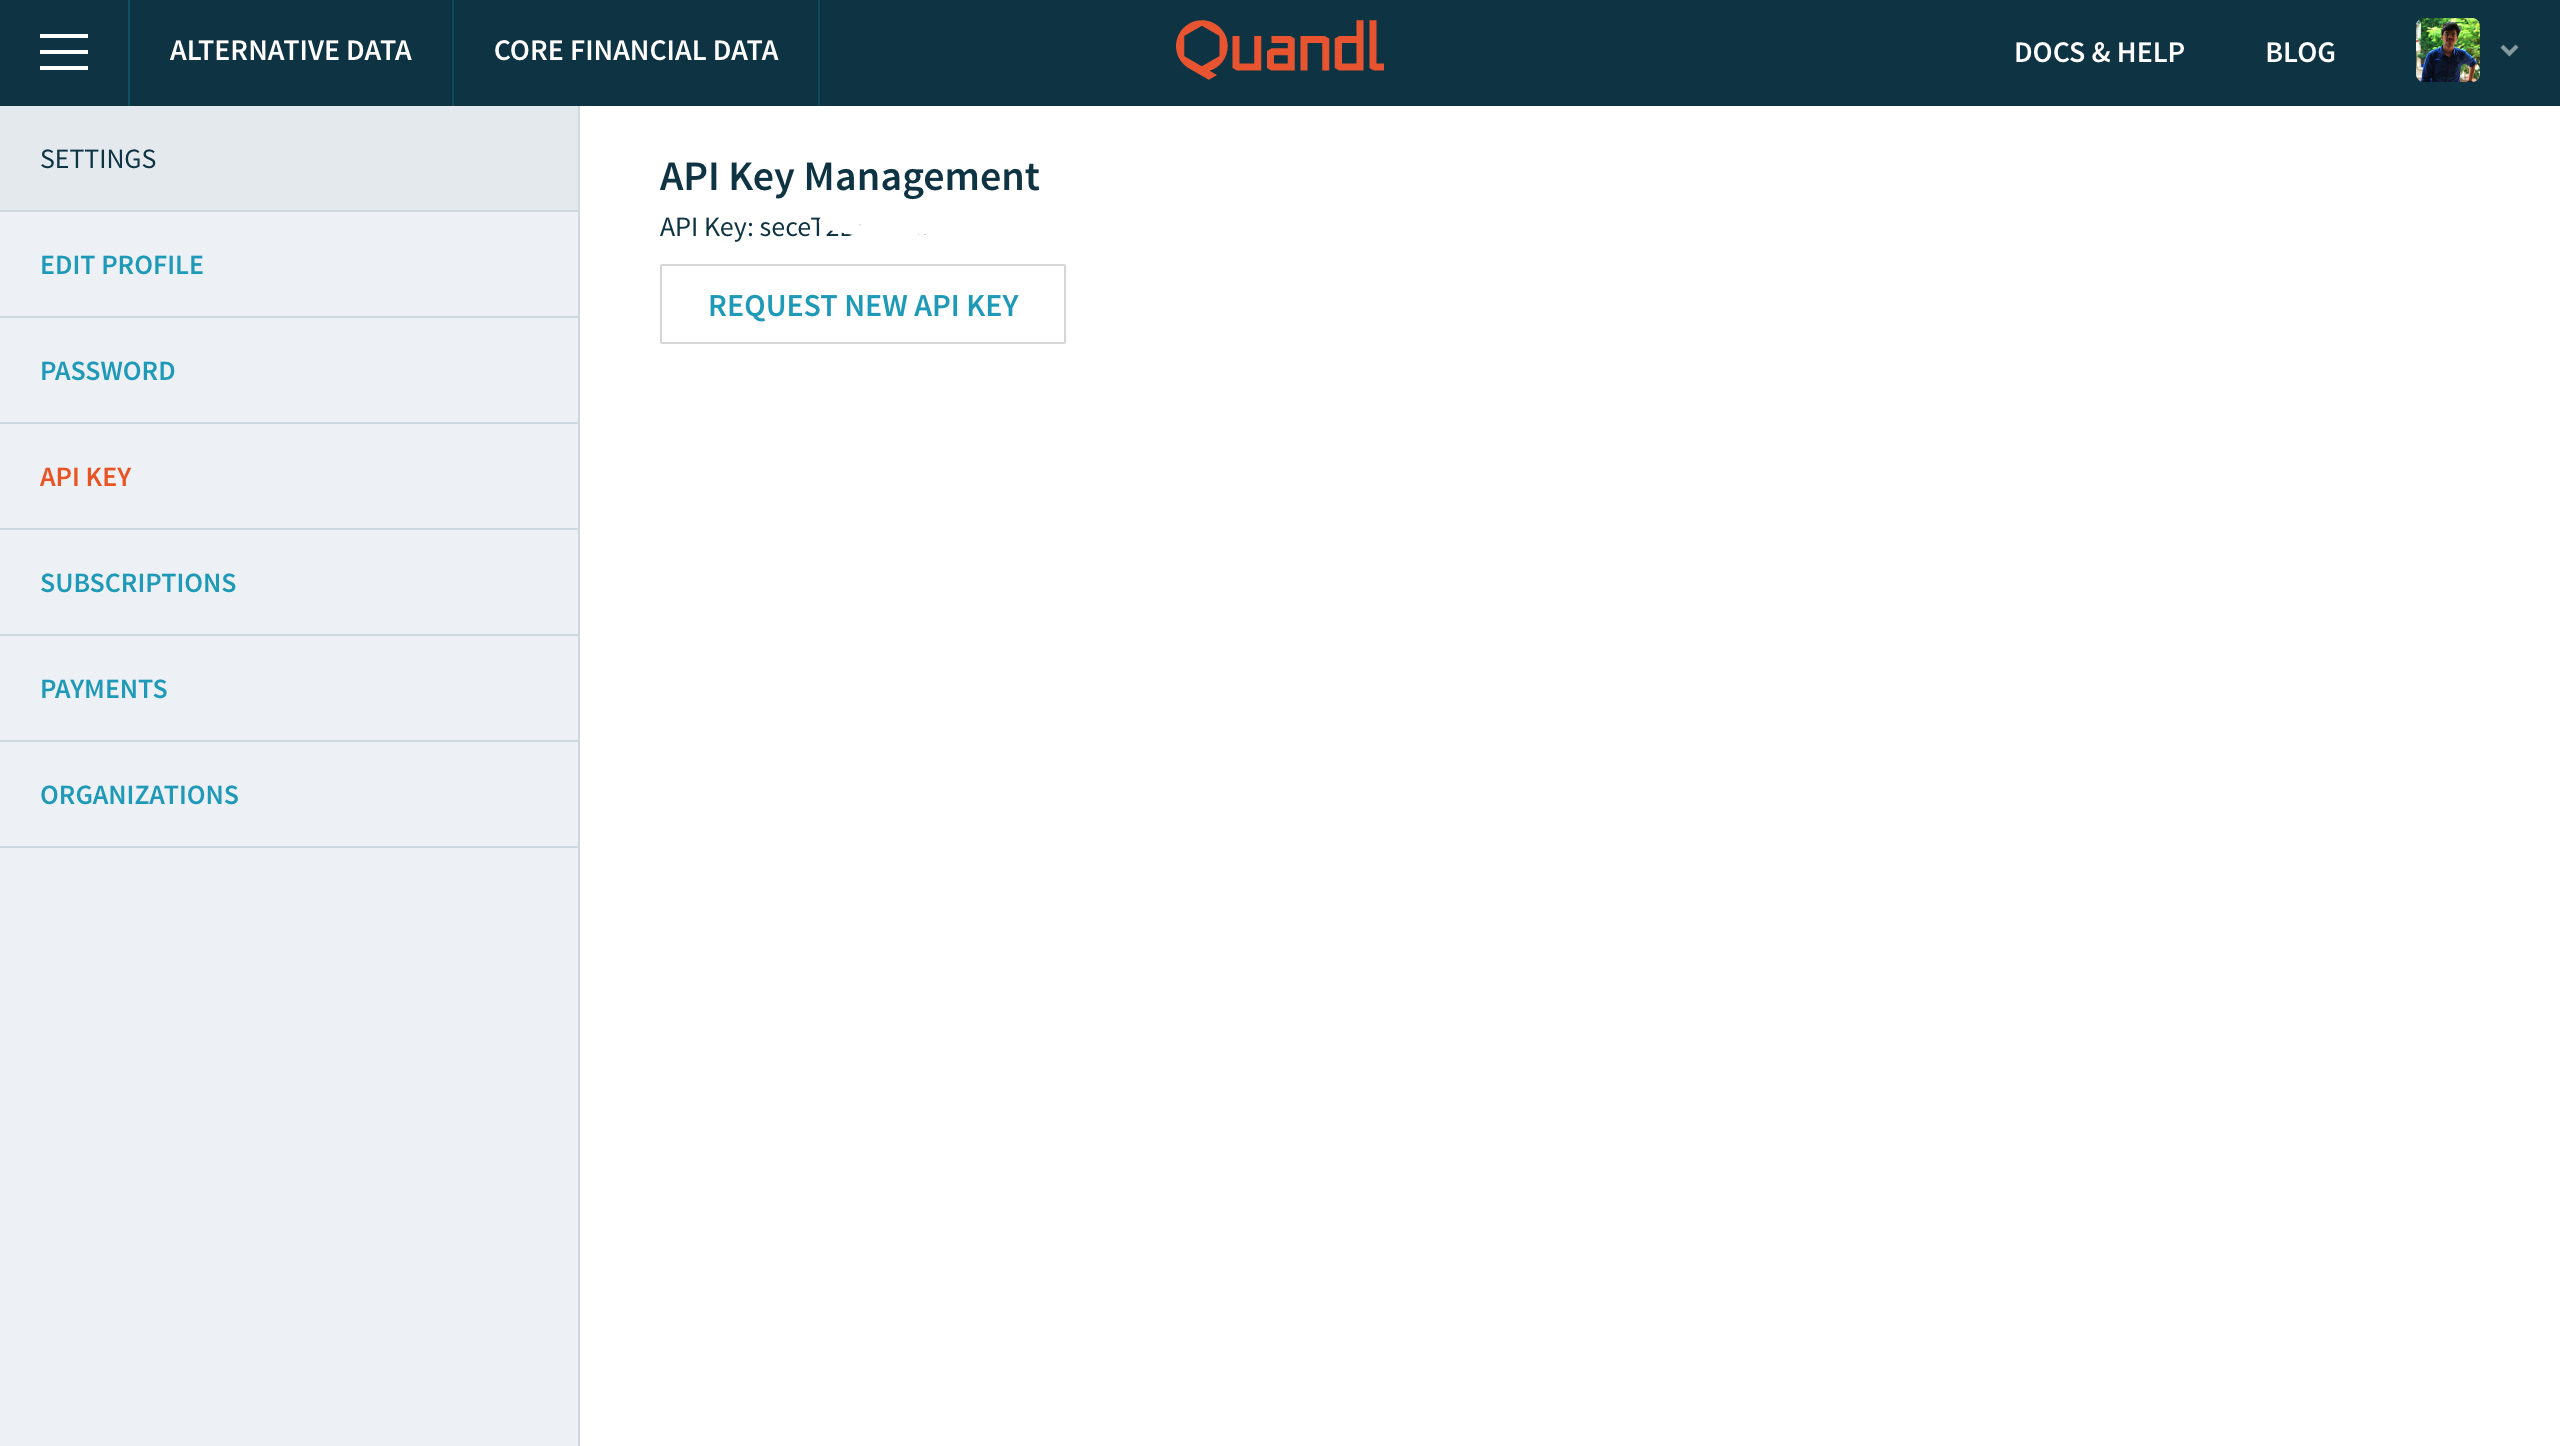
Keep a note of your API Key.
Sensitive data like API keys, tokens etc should be stored in Hasura secrets and then accessed as an environment variable in your app. Do the following to add your Quandl API Key to Hasura secrets.
$ # Paste the following into your terminal
$ # Replace <API-KEY> with the API Key you got from Quandl
$ hasura secret update quandl.api.key <API-KEY>
This value is injected as an environment variable (QUANDL_API_KEY) to the quandl service like so:
env:
- name: QUANDL_API_KEY
  valueFrom:
  secretKeyRef:
    key: quandl.api.key
    name: hasura-secrets
Check your k8s.yaml file inside microservices/quandl/app to check out the whole file.
Next, let's deploy the app onto your cluster.
Currently our database has not gotten any data from quandl. You can head over to your api console to check this out. It will have one table called quandl_checkpoint which stores the current offset at which the data in Hasura is stored.
$ # Run this in the quandl-metabase directory
$ hasura api-console
Let's use our quandl service to insert some data. To do this:
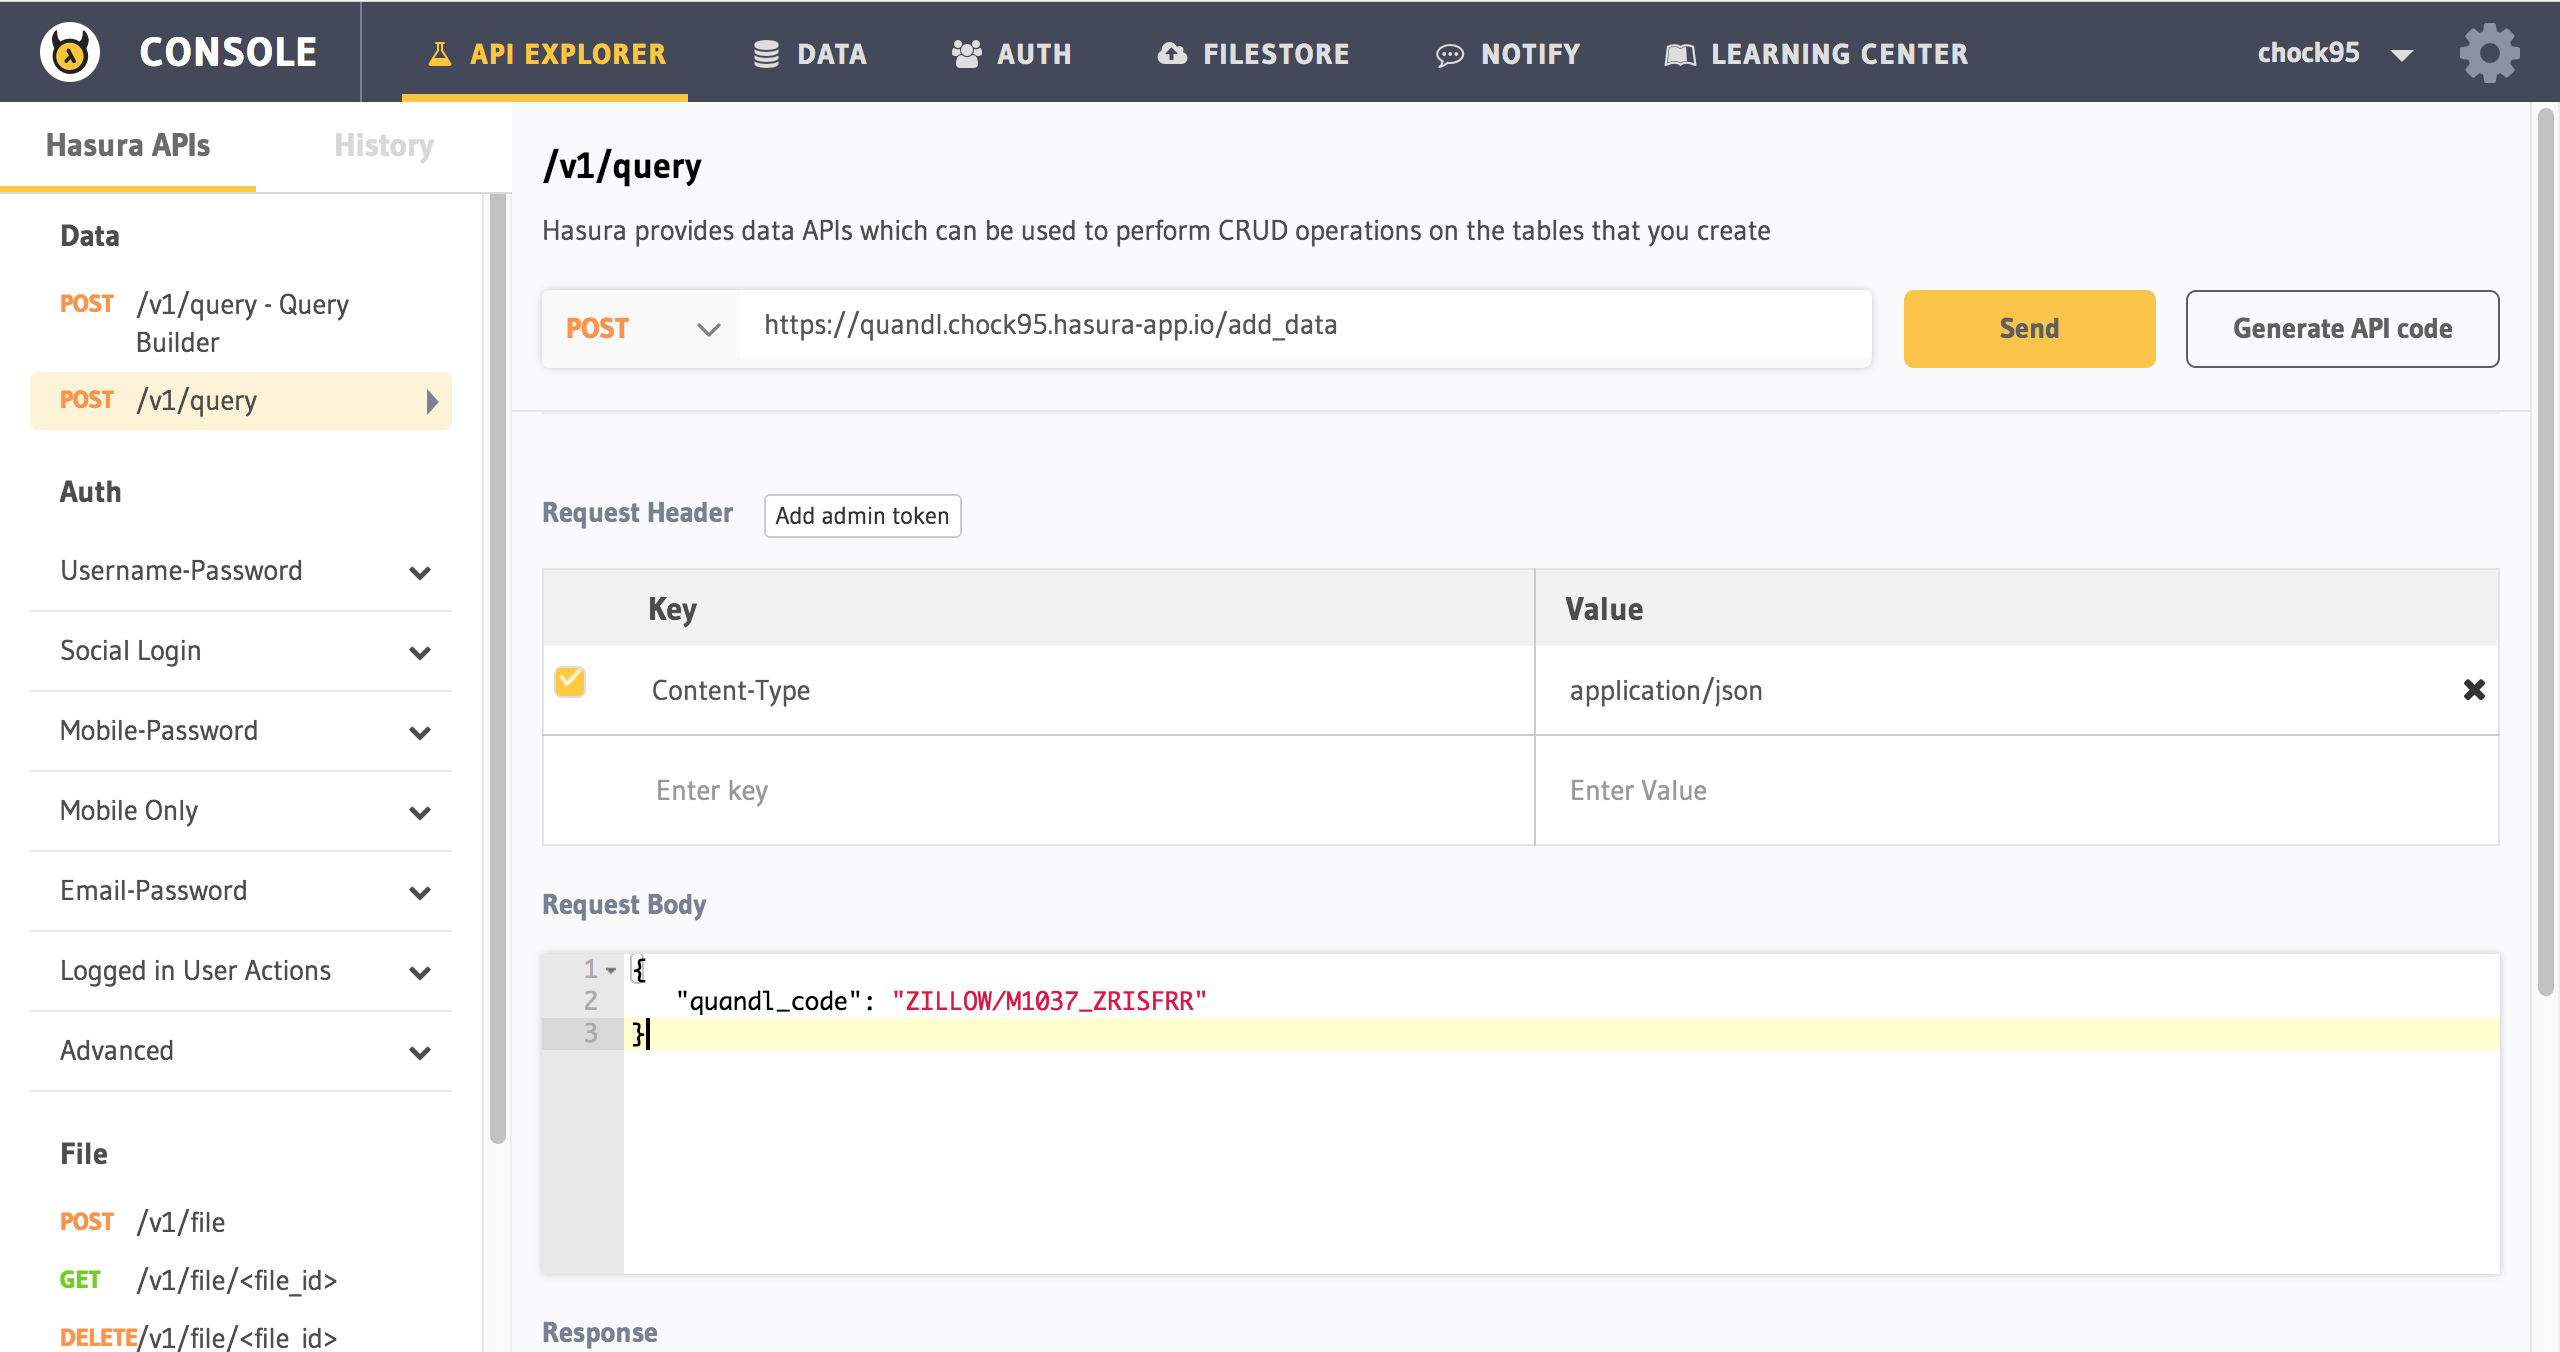
POST https://quandl.<CLUSTER-NAME>.hasura-app.io/add_data // remember to replace <CLUSTER-NAME> with your own cluster name (In this case, http://quandl.boomerang68.hasura-app.io/add_data)

{
    "quandl_code": "ZILLOW/M1037_ZRISFRR"
}
You can use a HTTP client of your choosing to make this request. Alternatively, you can also use the API Explorer provided by the Hasura api console to do this.
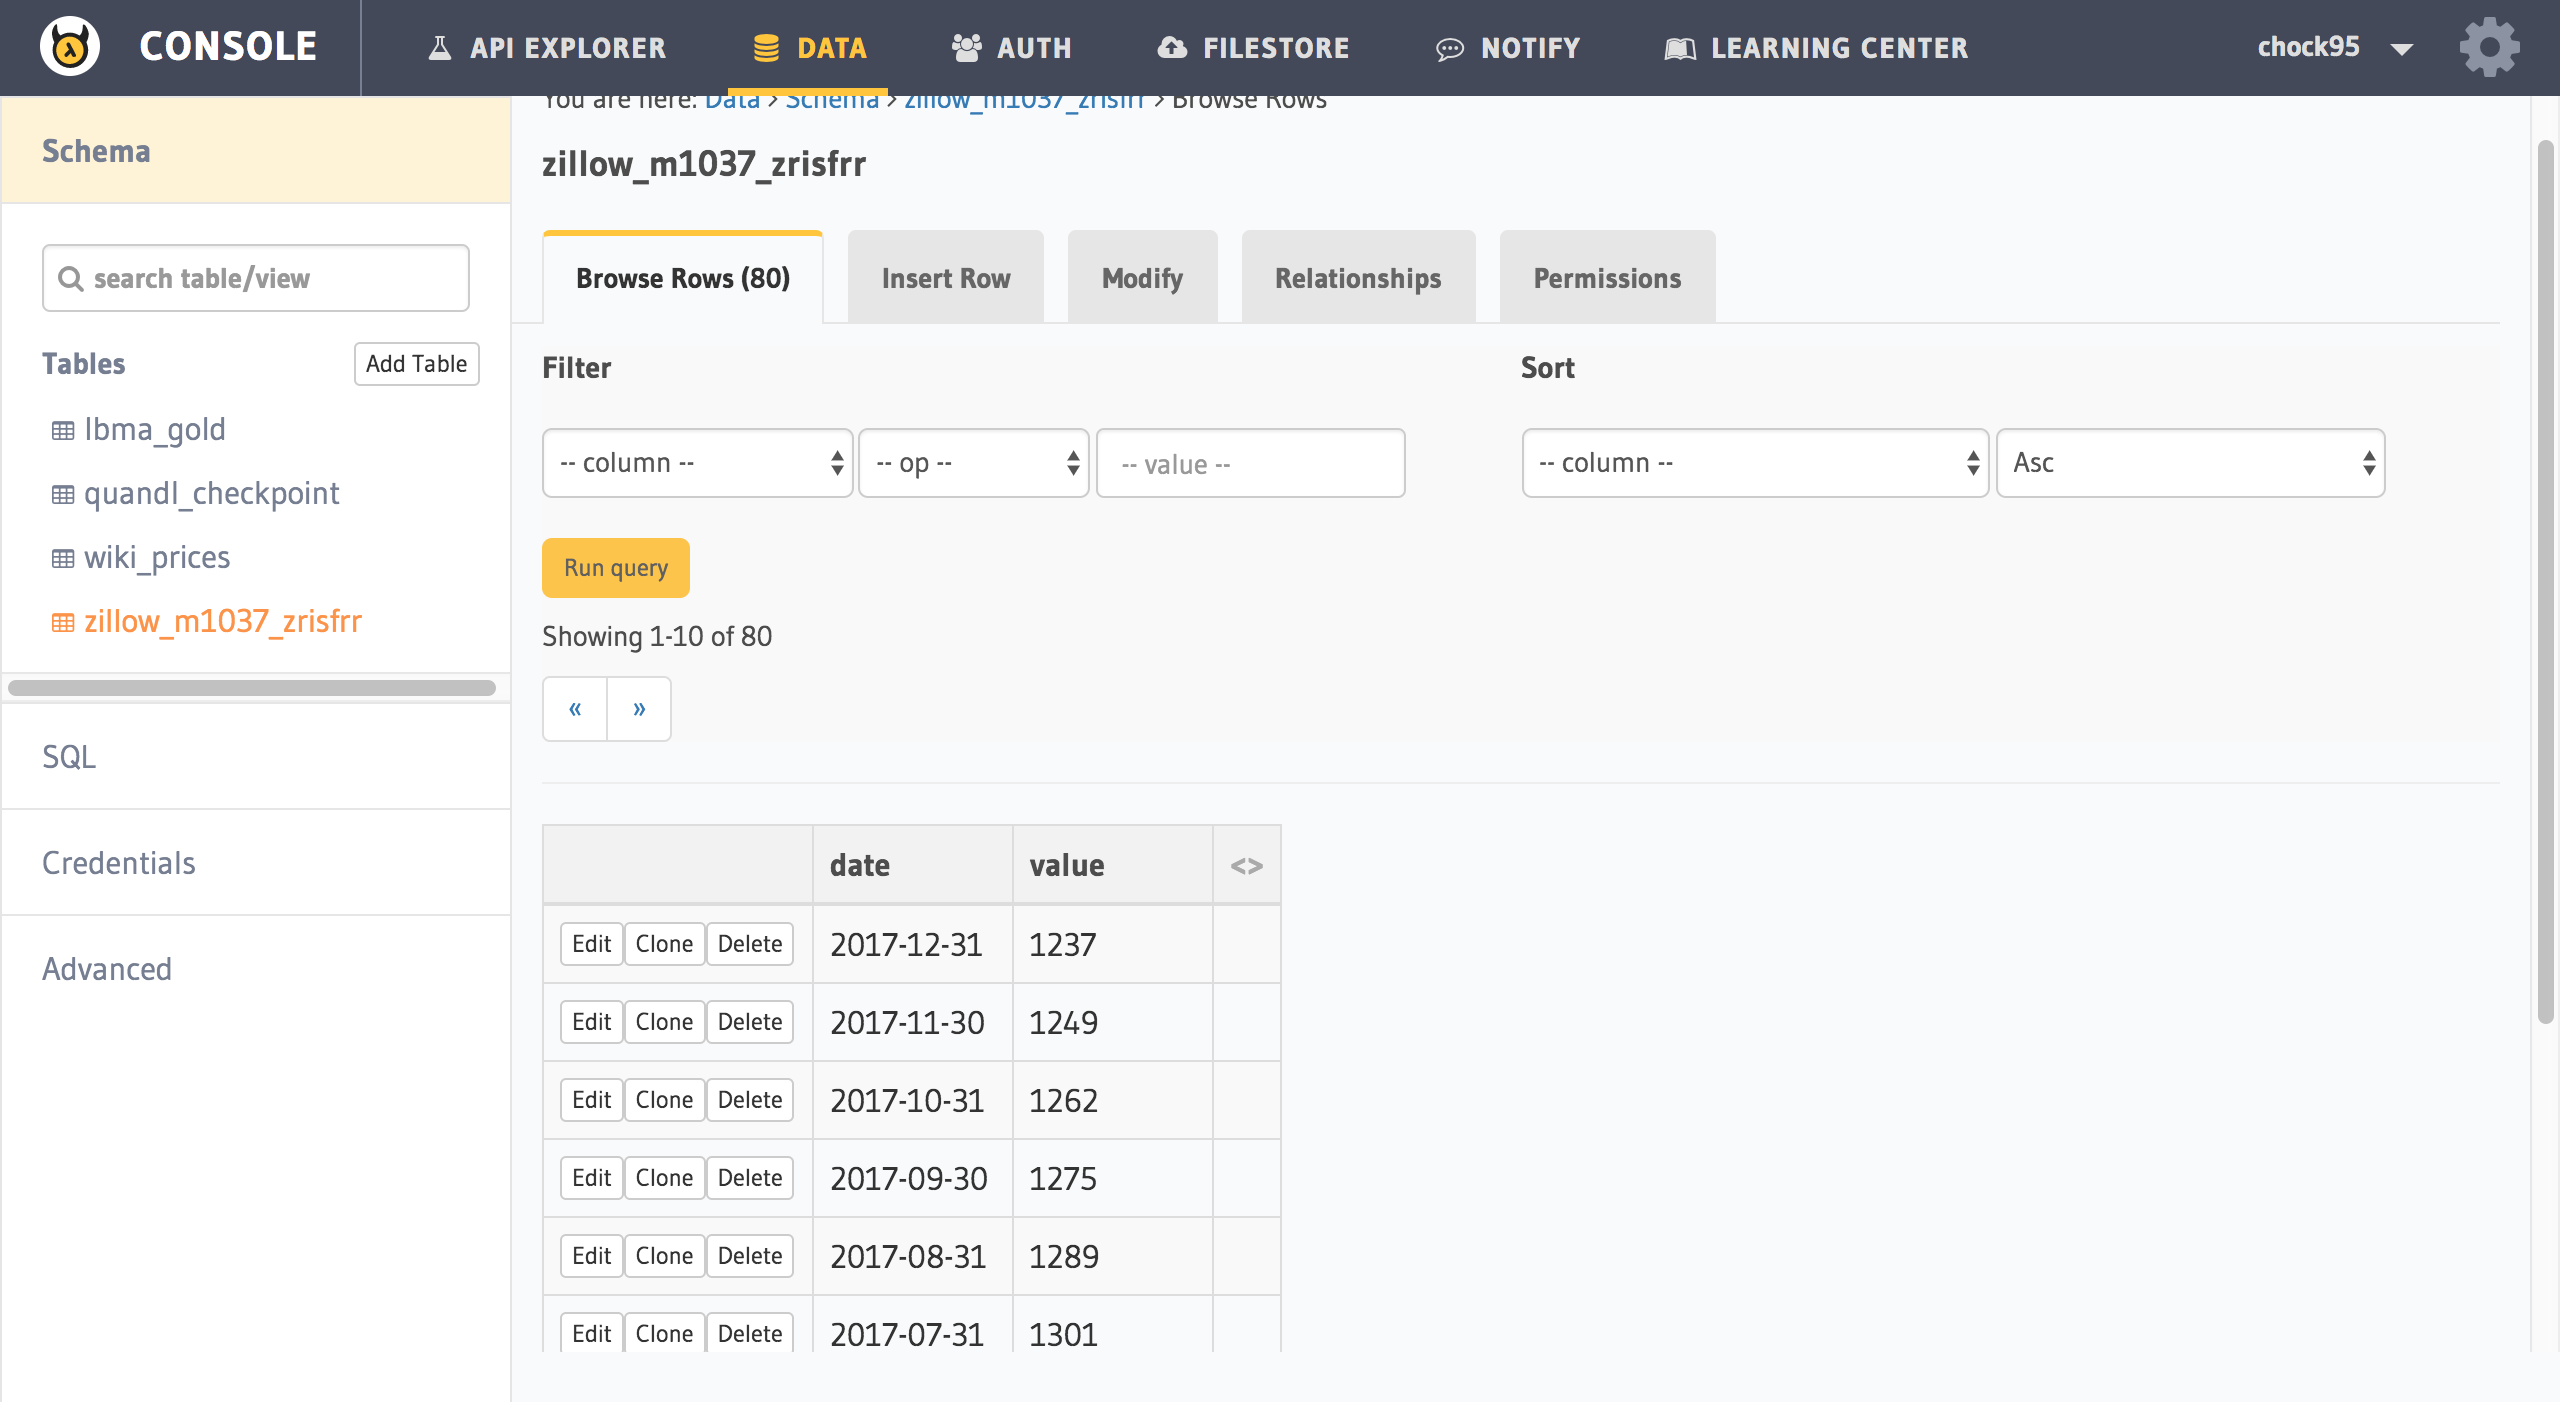
After sending the query, go to Data, and select the table name, and you can see the data inserted there.
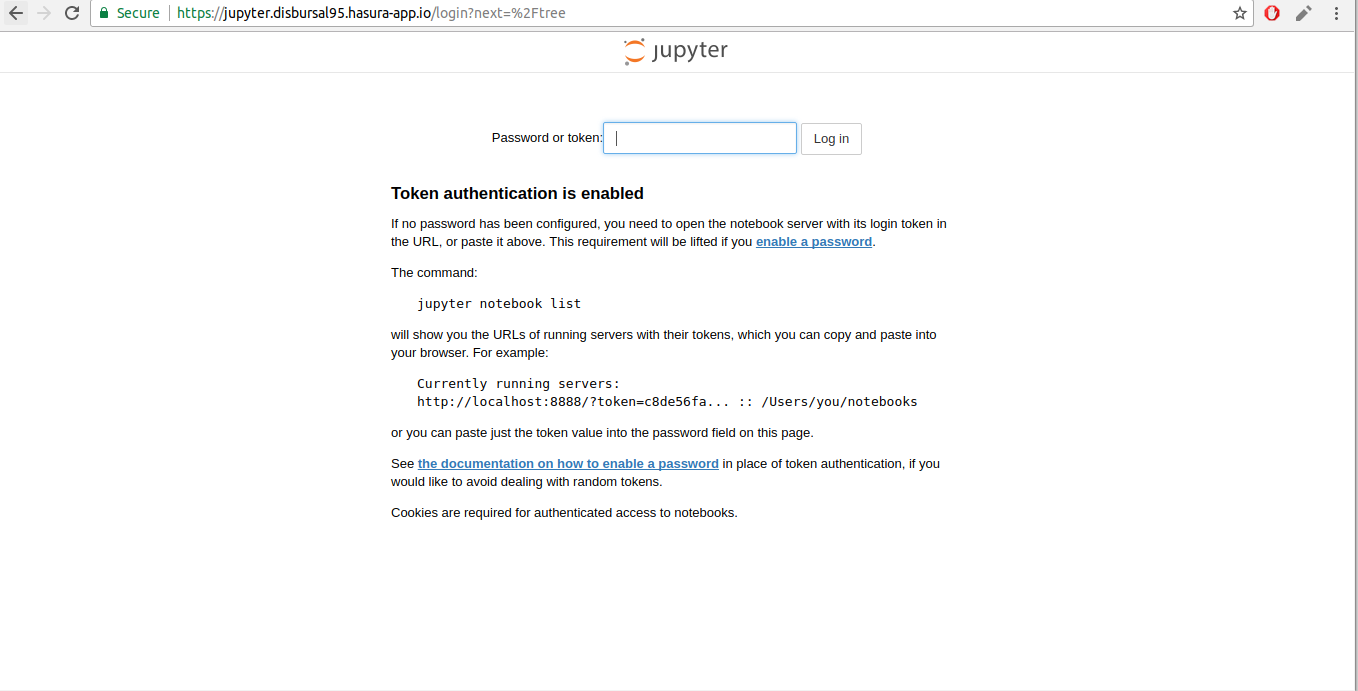
Head over to the EXTERNAL-URL of your jupyter service. (jupyter.cluster-name.hasura-app.io).
$ # Run this in the quandl-jupyter-risk-modeling directory
$ hasura ms logs jupyter
Copy the authentication token from the logs and enter it in the jupyter UI above.
Executing the command: jupyter notebook
[I 07:14:46.914 NotebookApp] Writing notebook server cookie secret to /home/jovyan/.local/share/jupyter/runtime/notebook_cookie_secret
[W 07:14:47.379 NotebookApp] WARNING: The notebook server is listening on all IP addresses and not using encryption. This is not recommended.
[I 07:14:47.428 NotebookApp] JupyterLab alpha preview extension loaded from /opt/conda/lib/python3.6/site-packages/jupyterlab
[I 07:14:47.428 NotebookApp] JupyterLab application directory is /opt/conda/share/jupyter/lab
[I 07:14:47.434 NotebookApp] Serving notebooks from local directory: /home/jovyan
[I 07:14:47.434 NotebookApp] 0 active kernels
[I 07:14:47.434 NotebookApp] The Jupyter Notebook is running at:
[I 07:14:47.434 NotebookApp] http://[all ip addresses on your system]:8888/?token=cd596a9b5e90a83283e4c9d6b792b4a58cac38e06153fd12
[I 07:14:47.434 NotebookApp] Use Control-C to stop this server and shut down all kernels (twice to skip confirmation).
[C 07:14:47.435 NotebookApp]

    Copy/paste this URL into your browser when you connect for the first time,
    to login with a token:
        http://localhost:8888/?token=cd596a9b5e90a83283e4c9d6b792b4a58cac38e06153fd12
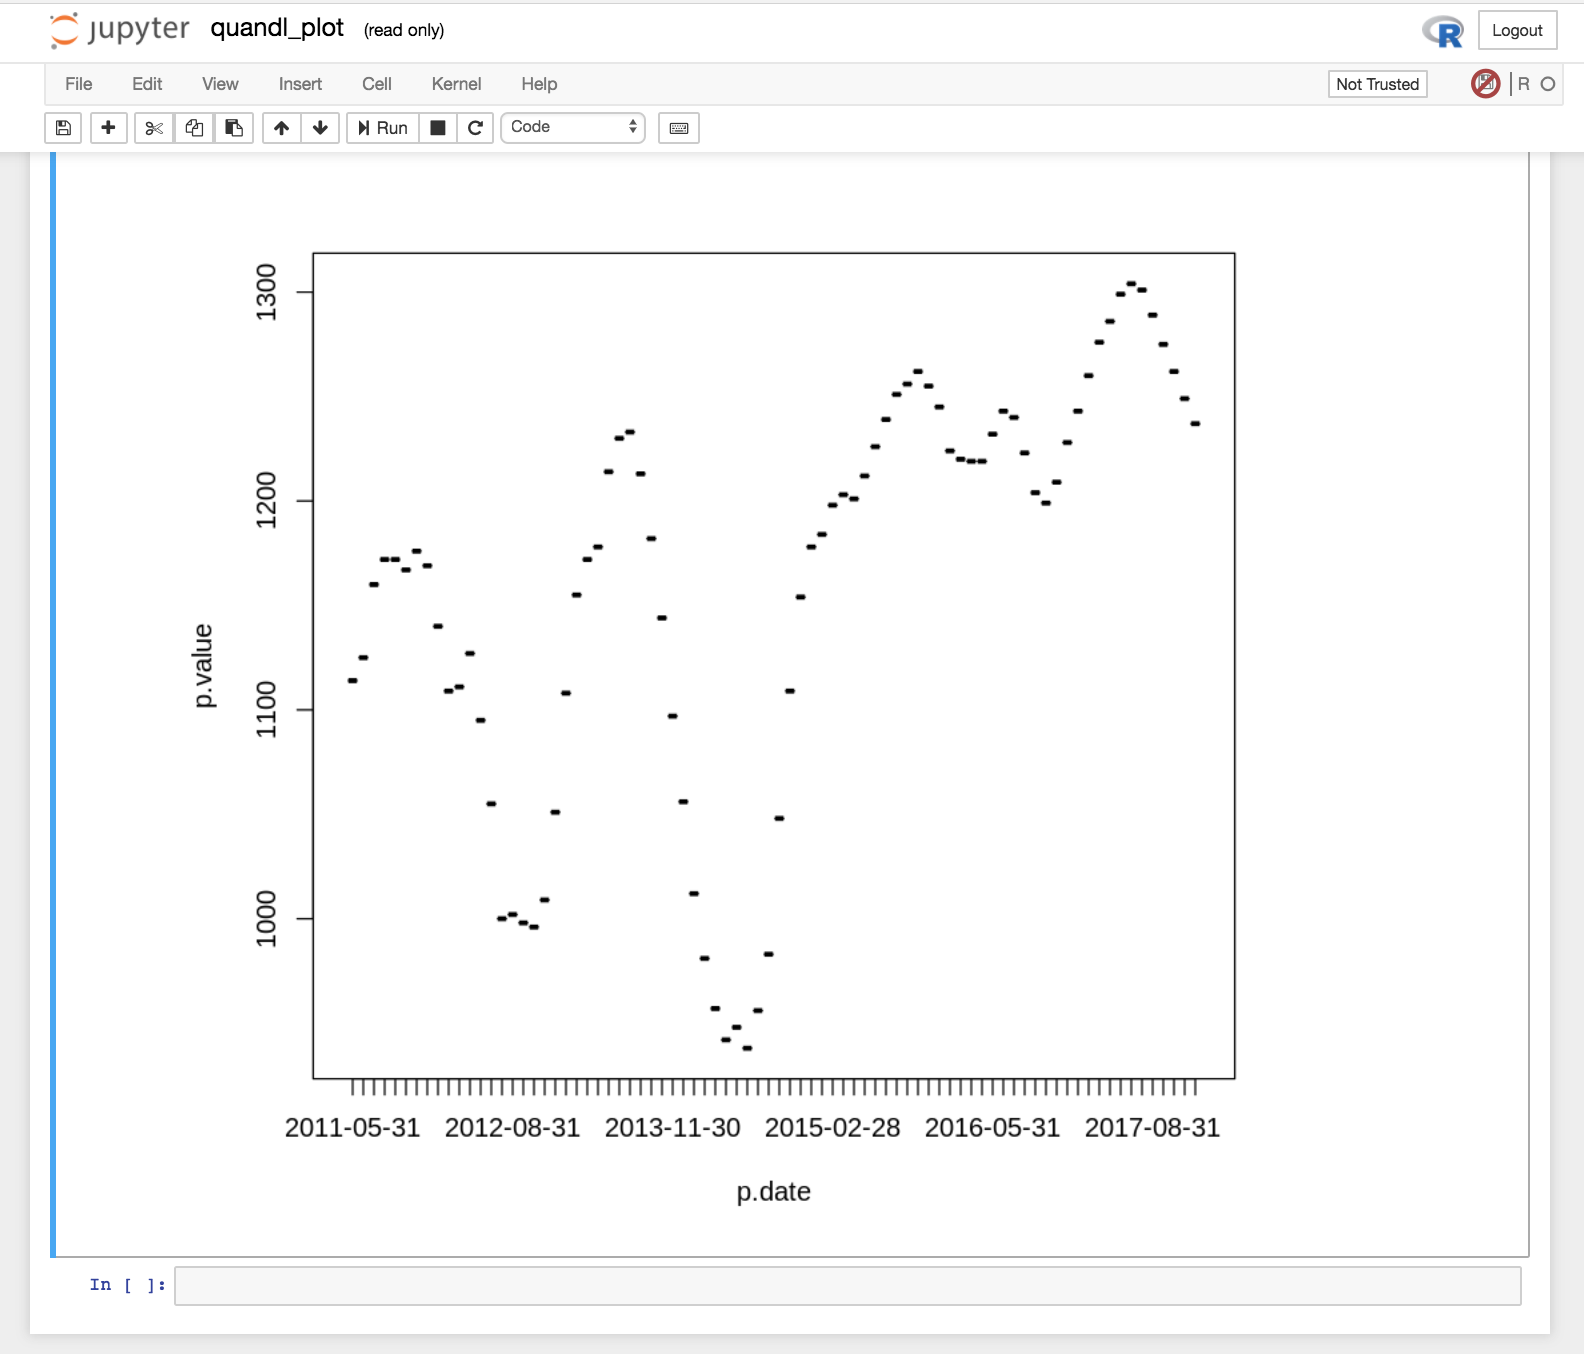
You should see the familiar Jupyter notebook dashboard with a ready quandl notebook.
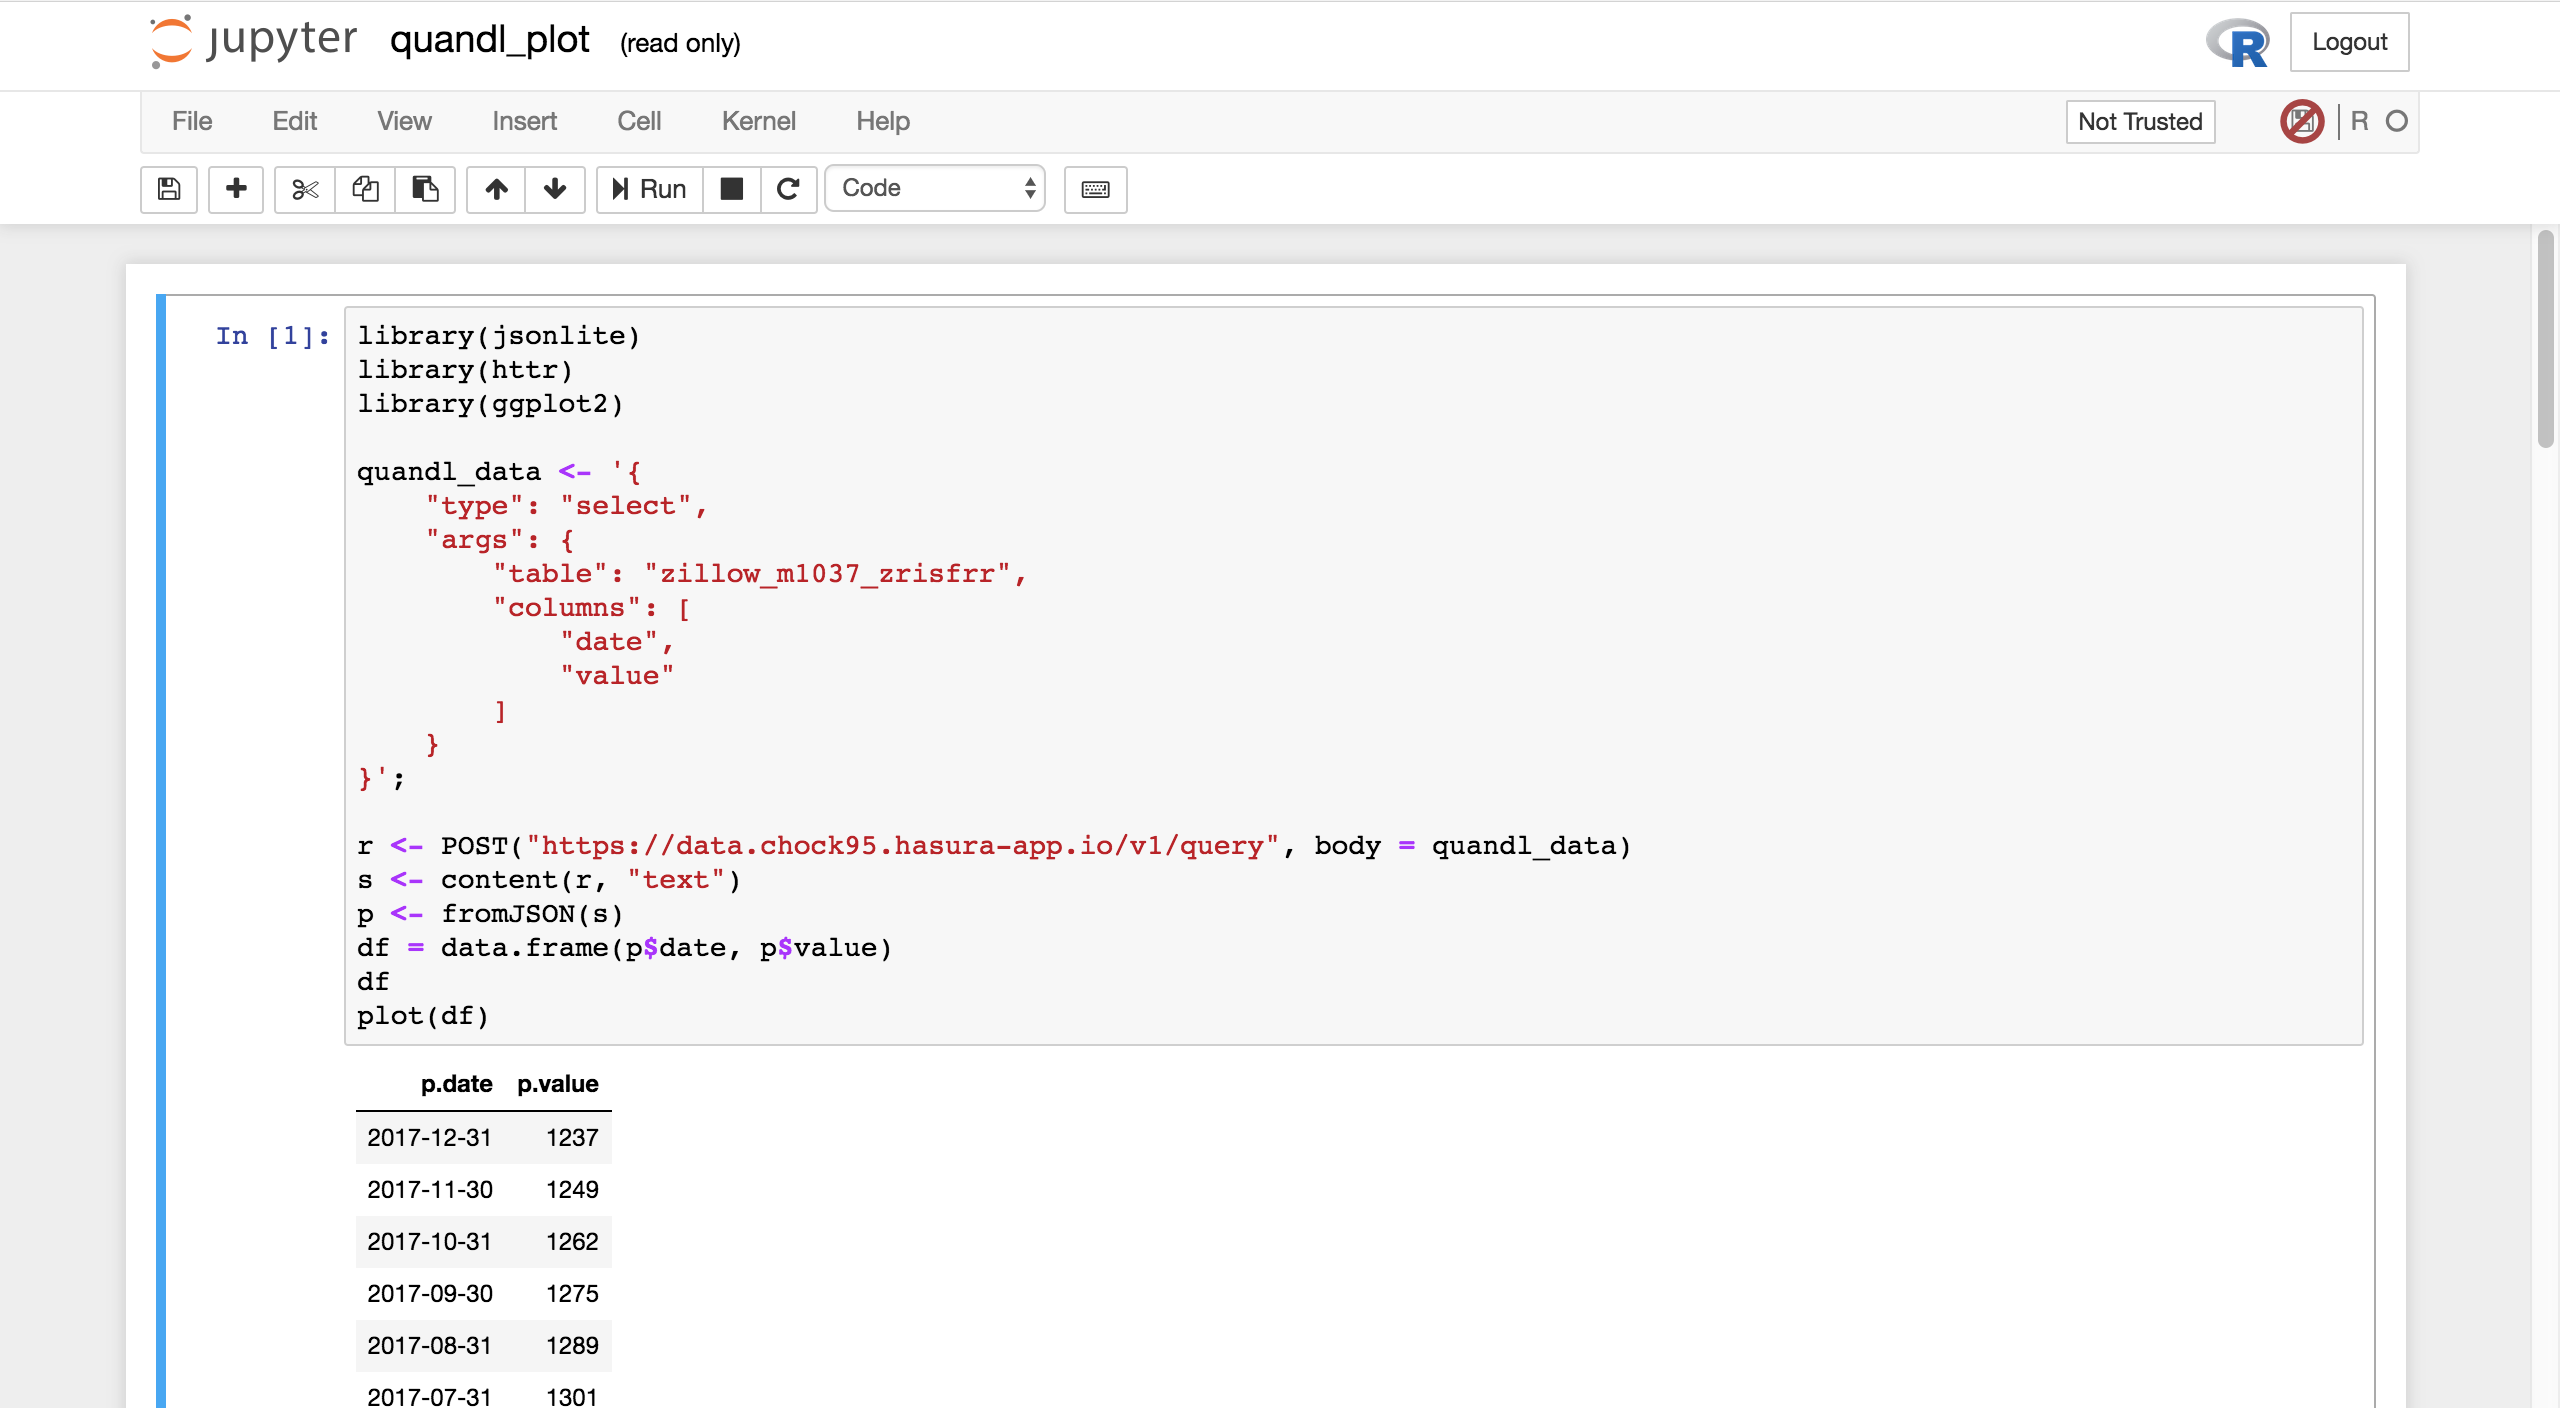
Running the quandl notebook should fetch the data from the Postgres database, and plot the time-series with date as x axis, and the values as y-axis.