
3D printable CNVpytor logo (stl file)
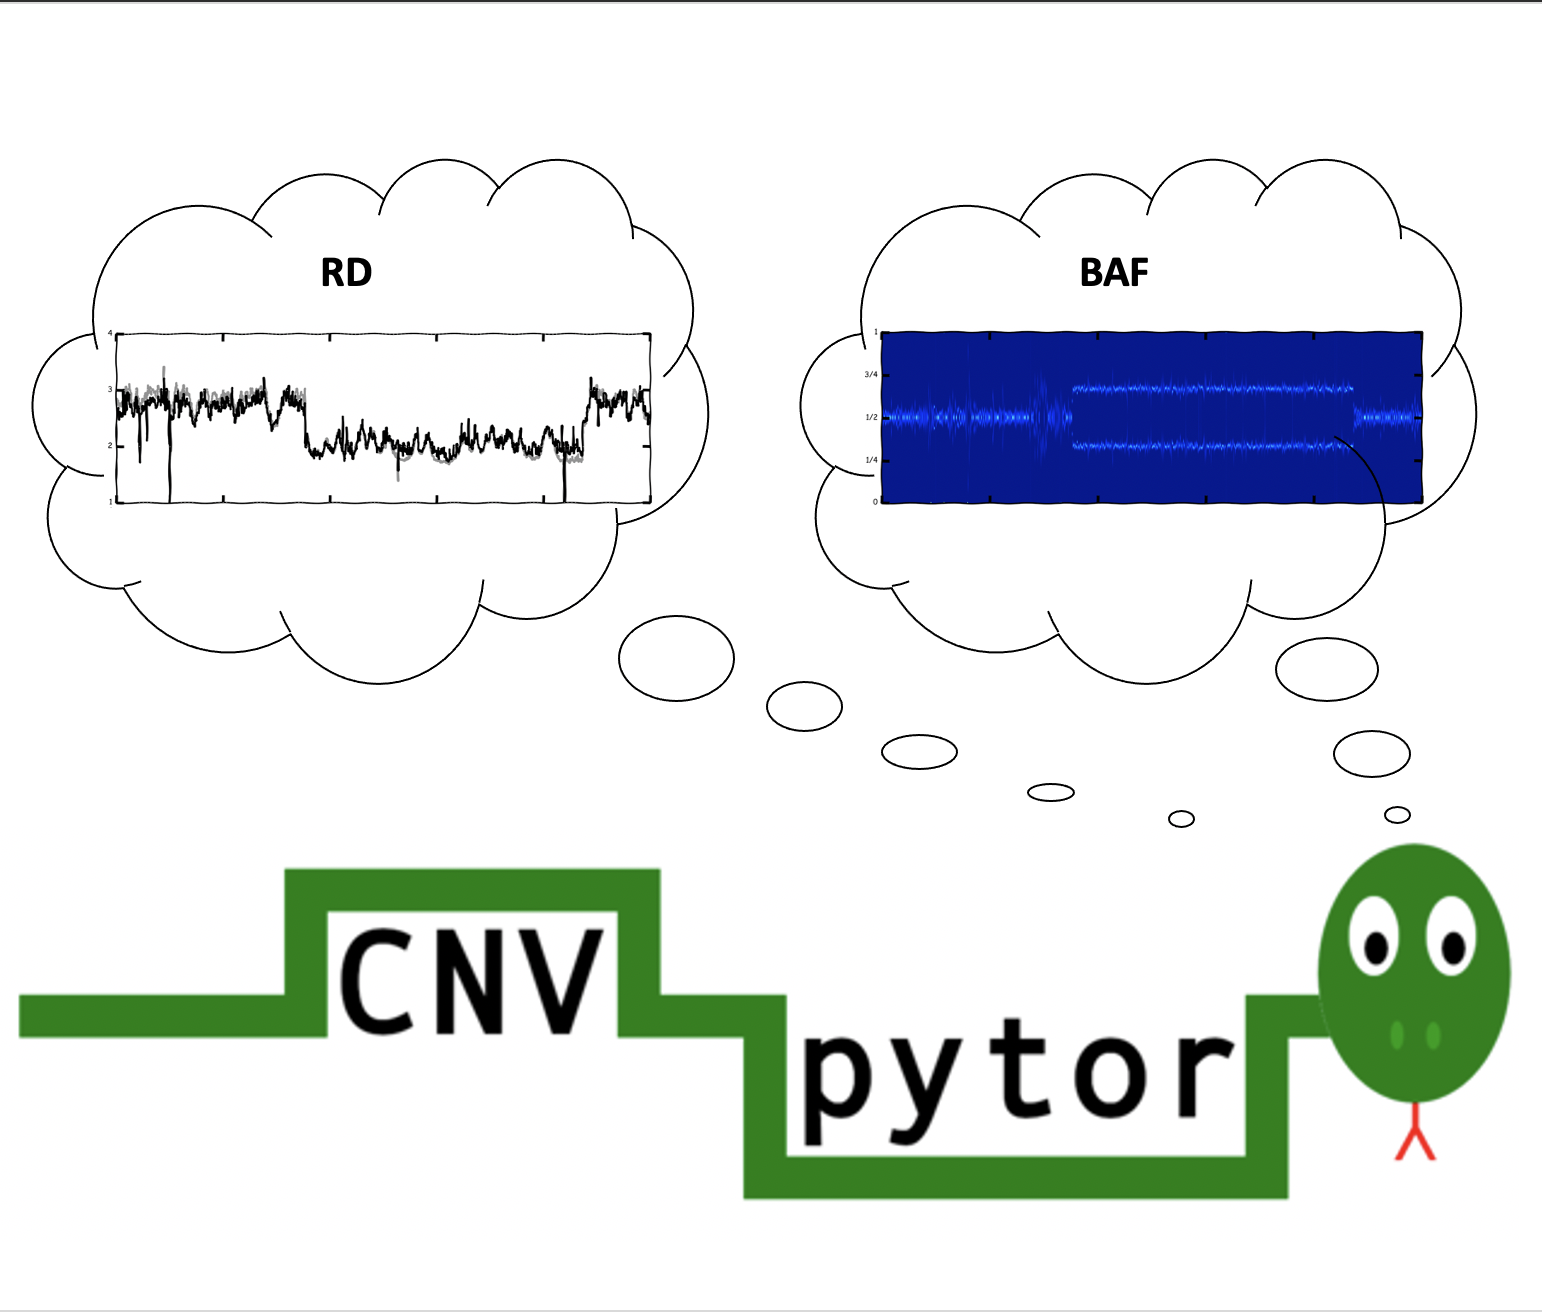
CNVpytor is a Python package and command line tool for CNV/CNA analysis from depth-of-coverage by mapped reads developed in Abyzov Lab, Mayo Clinic.
Follow CNVpytor Twitter account.
What's new:
- Reduced Pytor file size by compressing the BAF likelihood matrix
- Option to avoid storing the full BAF likelihood matrix (-nolh), drastically reducing the final Pytor file size to less than 50 MB
- If the full BAF likelihood matrix is not stored in Pytor file, during -call step likelihood will be calculated during run time
- Introduced plotting parameter "lh_lite," used when the full BAF likelihood matrix is not present in the Pytor file
- Implemented log scale for Manhattan plot (#126)
- Added plot RD difference/ratio between two samples (#151)
- Updated the code for VCF output
- Included an error log for missing annotation links in reference genome settings
- Added matplotlib_use parameter to set the Matplotlib backend
CNVpytor: a tool for copy number variation detection and analysis from read depth and allele imbalance in whole-genome sequencing
Milovan Suvakov, Arijit Panda, Colin Diesh, Ian Holmes, Alexej Abyzov, GigaScience, Volume 10, Issue 11, November 2021, giab074
https://doi.org/10.1093/gigascience/giab074
- Geting started with command line interface
- Jupyter notebook: How to use CNVpytor from Python
- Google Colab: With CEPH trio example dataset
- Video Tutorial: 3-minute YT demo
- Demo Video
- Links
- Test Link: https://arpanda.github.io/igv.js/examples/cnvpytor/
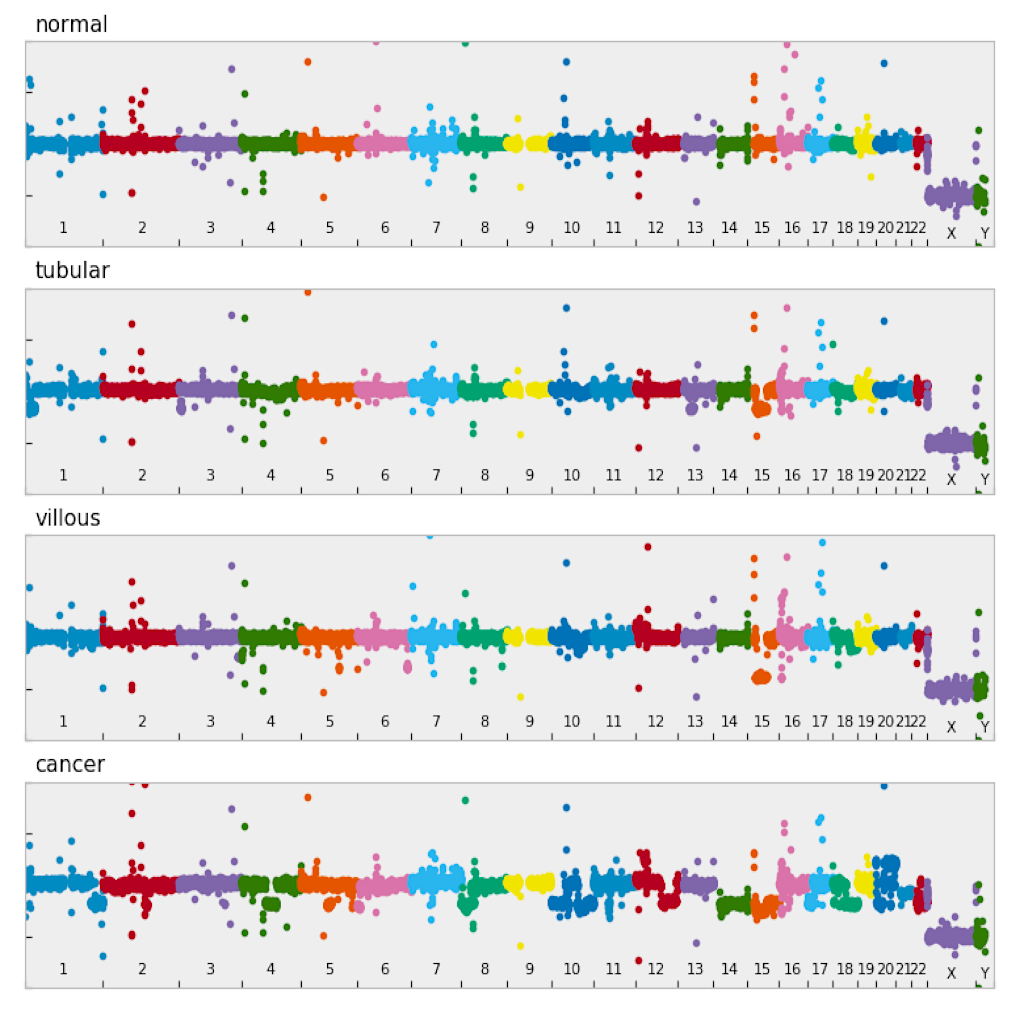
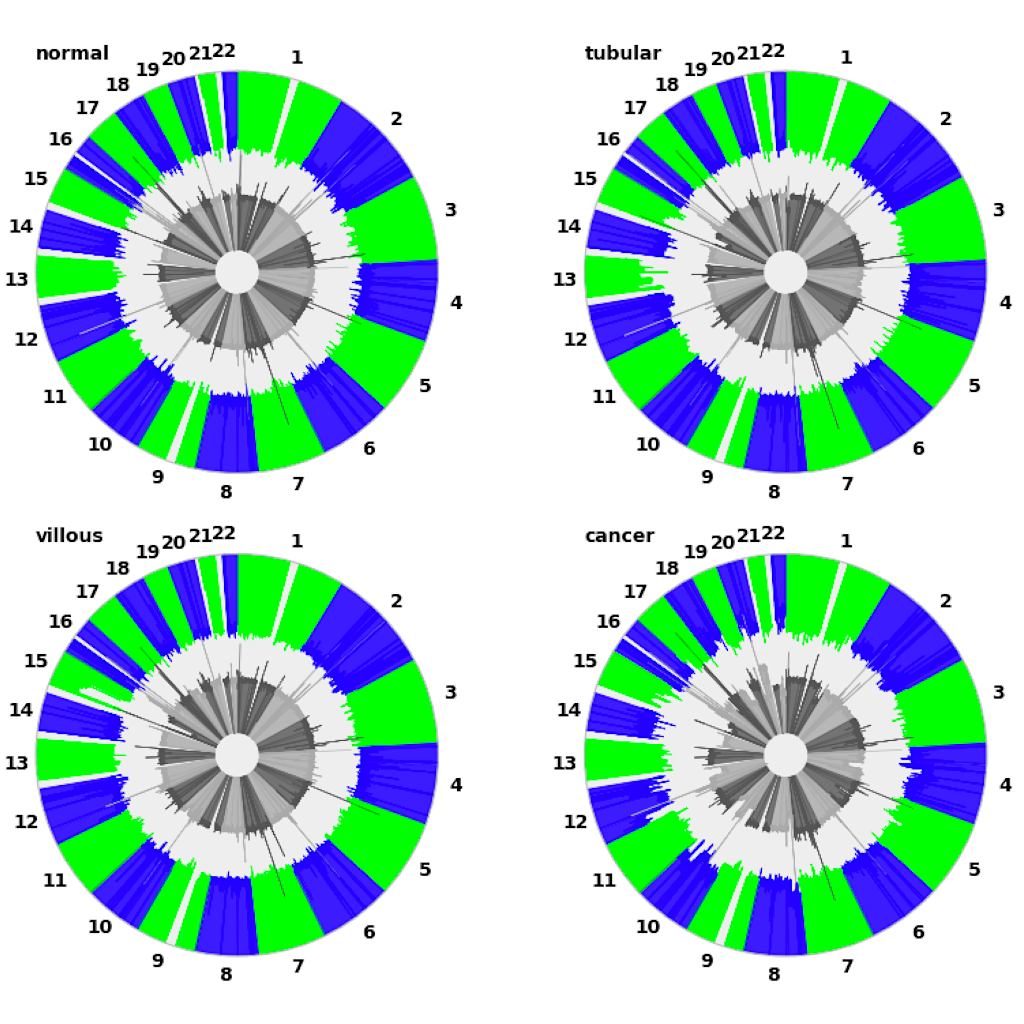
| Manhattan plot (see example) | Circular plot (see example) |
 |
 |
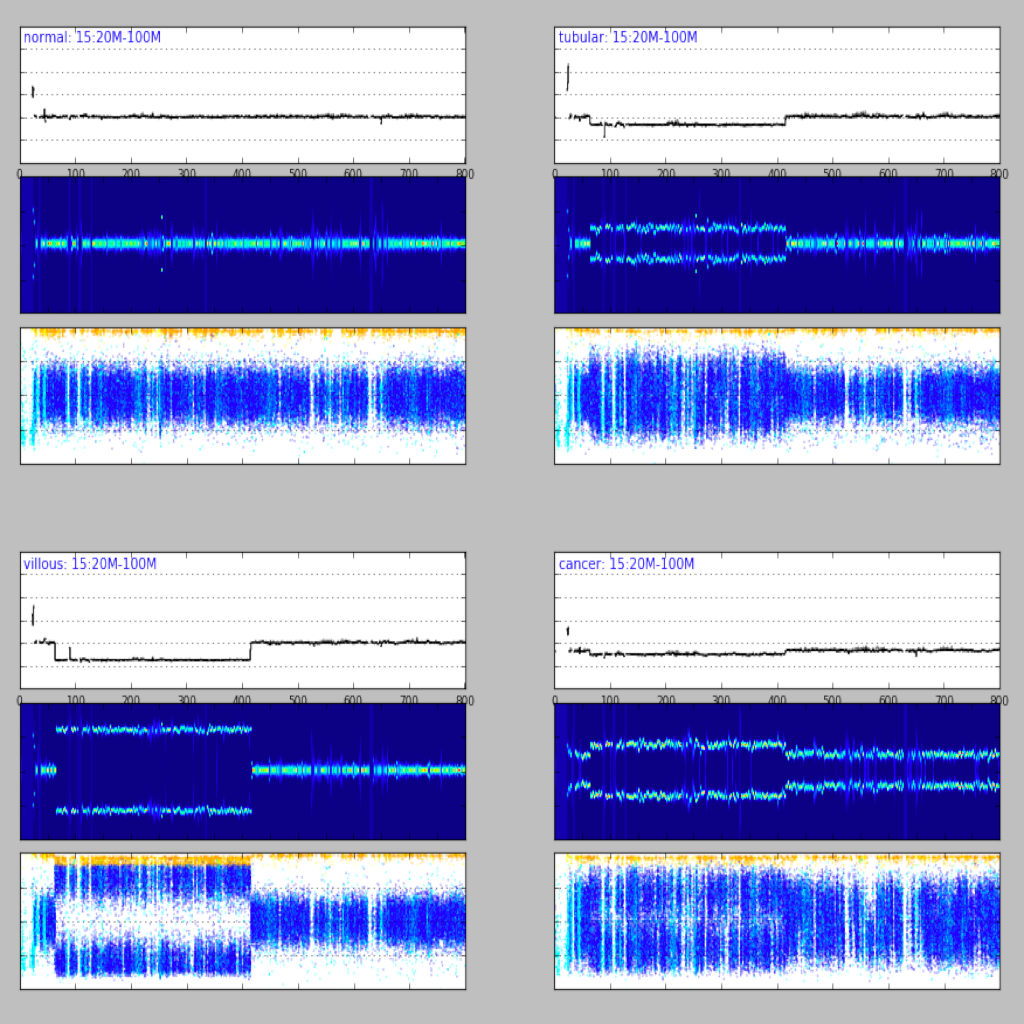
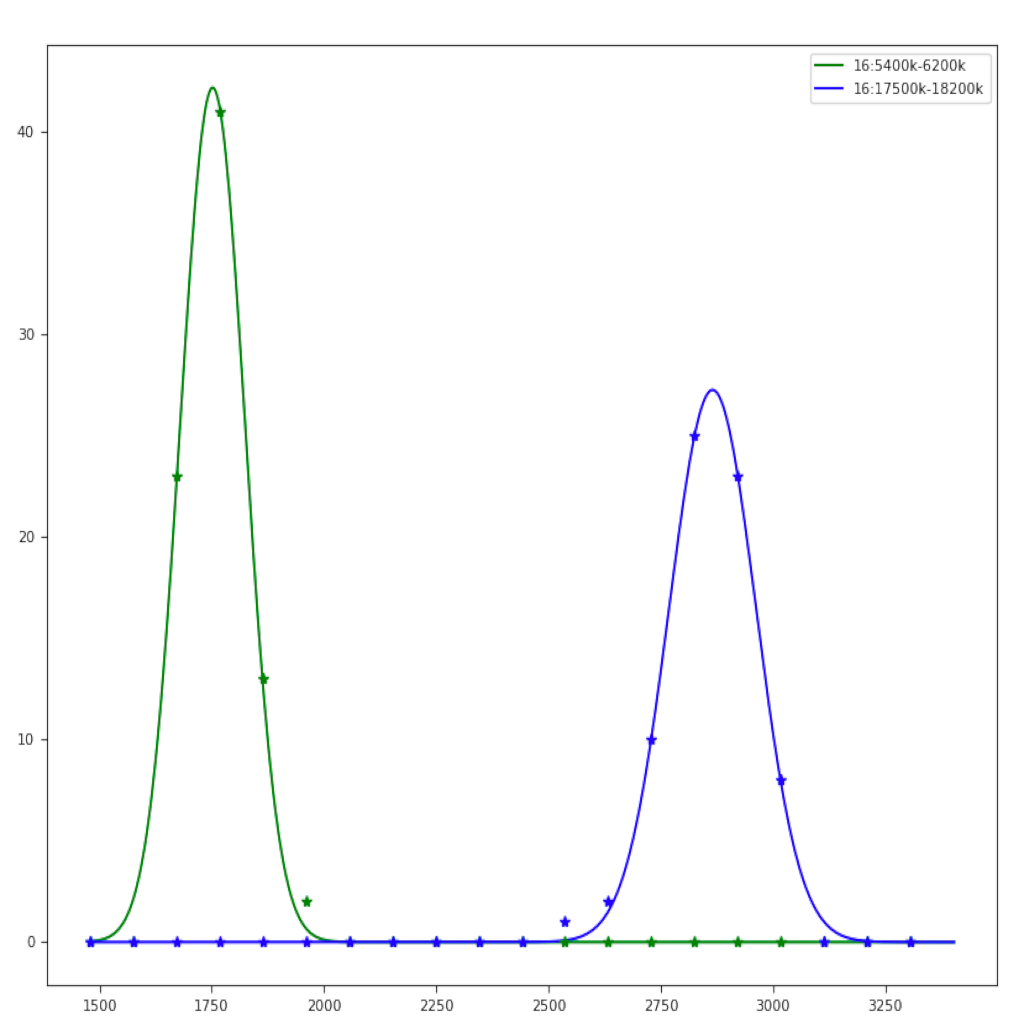
| Region plot (see example) | Compare regions (see example) |
 |
 |
| Merging and annotating calls (see example) | Call somatic CNAs (see example) |
 |
 |
- requests>=2.0
- gnureadline
- pathlib>=1.0
- pysam>=0.15
- numpy>=1.16
- scipy>=1.1
- matplotlib>=2.2
- h5py>=2.9
- xlsxwriter>=1.3
- pathlib>=1.0
Optional:
- pyBigWig - for JBrowse export functionality
- ROOT - for CNVnator root import/export functionality
- seaborn - for additional plotting styles
> git clone https://github.com/abyzovlab/CNVpytor.git
> cd CNVpytor
> pip install .
For single user (without admin privileges) use:
> pip install --user .
Version (v1.2.1) is available using pip directly:
> pip install cnvpytor
> cnvpytor -download

Diagram made using Draw.io.
> cnvpytor -root file.pytor -rd file.bam
> cnvpytor -root file.pytor -his 1000 10000 100000
> cnvpytor -root file.pytor -partition 1000 10000 100000
> cnvpytor -root file.pytor -call 1000 10000 100000
> cnvpytor -root file.pytor -snp file.vcf -sample sample_name
> cnvpytor -root file.pytor -pileup file.bam                   # OPTIONAL
> cnvpytor -root file.pytor -mask_snps                         # OPTIONAL
> cnvpytor -root file.pytor -baf 10000 100000
> cnvpytor -root file.pytor -view 100000
print calls
set Q0_range 0 0.5
set size_range 100000 inf
print calls
set p_range 0 0.00001
set print_filename output.xls
print calls
set print_filename output.vcf
print calls
Annotating filtered calls:
> cnvpytor -root file.pytor -view 100000
set Q0_range 0 0.5
set size_range 100000 inf
set print_filename output.tsv
set annotate
print calls
> cnvpytor -root file1.pytor file2.pytor ... -view 100000
print merged_calls
set Q0_range 0 0.5
set size_range 100000 inf
set print_filename output.xls
print merged_calls
Plotting all merged calls:
> cnvpytor -root file1.pytor file2.pytor ... -view 100000
set Q0_range 0 0.5
set size_range 100000 inf
set print_filename output.xls
set print
set output_filename prefix.png
print merged_calls
Annotating merged calls:
> cnvpytor -root file1.pytor file2.pytor ... -view 100000
set Q0_range 0 0.5
set size_range 100000 inf
set print_filename output.xls
set annotate
print merged_calls
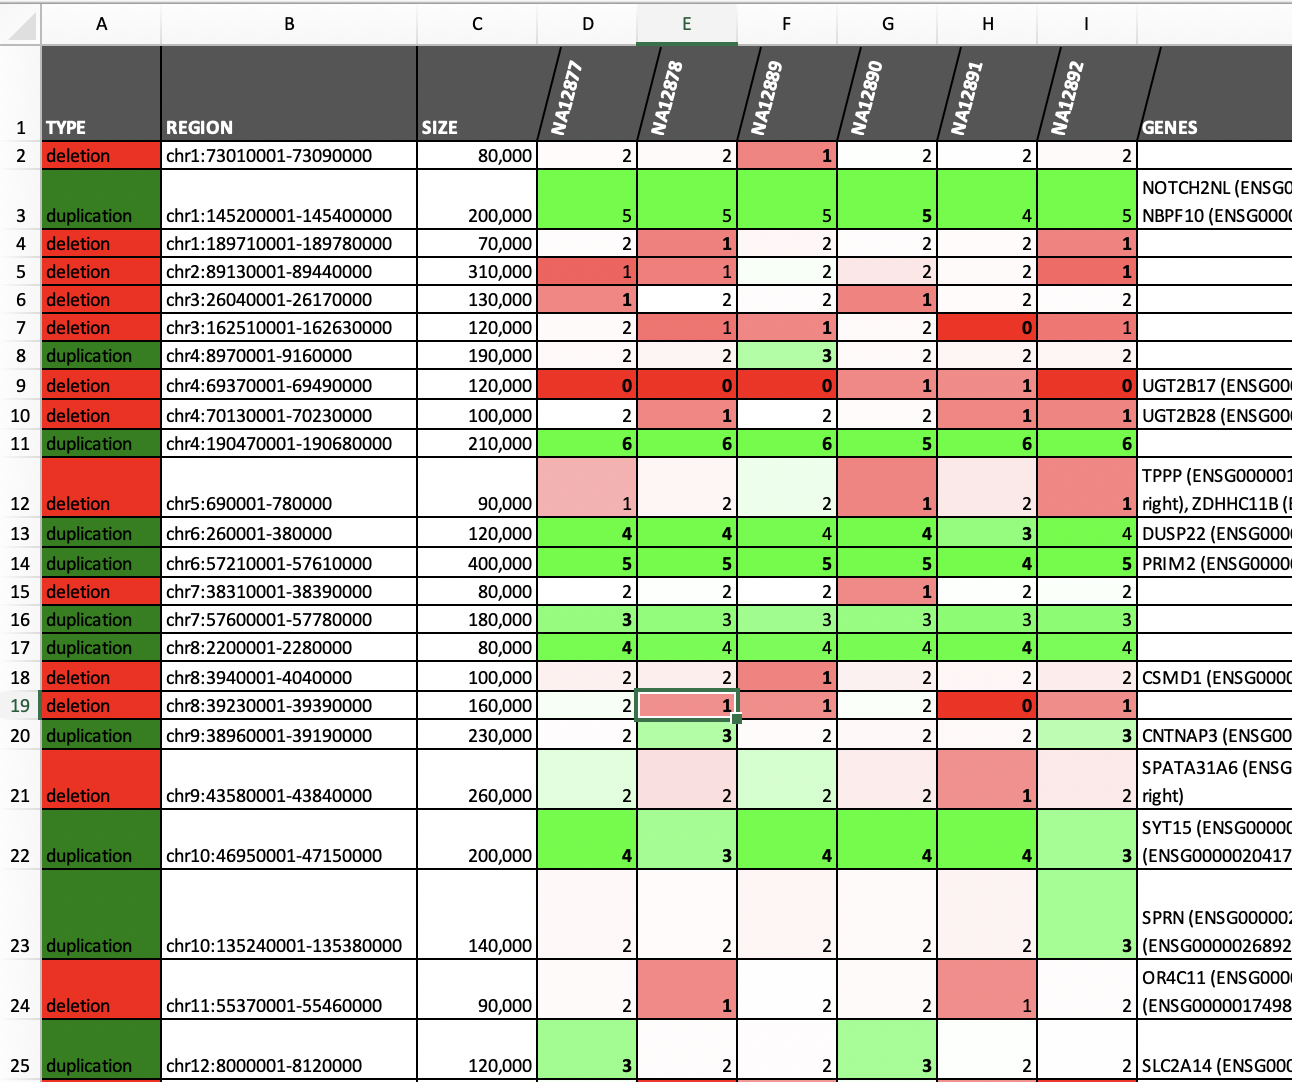
> cnvpytor -root file.pytor -genotype 10000 100000
12:11396601-11436500
12:11396601-11436500	1.933261	1.937531
22:20999401-21300400
22:20999401-21300400	1.949186	1.957068
Genotyping with additional informations:
> cnvpytor -root file.pytor -genotype 10000 100000 -a
12:11396601-11436500
12:11396601-11436500    2.0152  1.629621e+04    9.670589e+08    0.0000  0.0000  4156900 1.0000  50      4       0.0000  1.000000e+00
Genotyping using P filtered (1000 Genome Project strict mask) RD signal:
> cnvpytor -root file.pytor -genotype 10000 100000 -a -rd_use_mask
1:800k-900k
1:800000-900000 2.3012  1.032124e+01    8.296037e+06    0.0021  0.0000  278700  0.8000  48      28      0.0000  1.000000e+00
CNVpytor view interactive mode is implemented with completion and internal documentation (help command).
To enter interactive mode use '-view bin_size' option:
> cnvpytor -root file.pytor -view 10000
cnvpytor> chr1:1M-50M
cnvpytor> rd
cnvpytor> set panels rd likelihood
cnvpytor> show
Parameters
    * baf_colors: ['gray', 'black', 'red', 'green', 'blue']
    * bin_size: 100000
    * chrom: []
    * contrast: 20
    * dpi: 200
    * file_titles: []
    * grid: auto
    * lh_colors: ['yellow']
    * markersize: auto
    * min_segment_size: 0
    * output_filename:
    * panels: ['rd']
    * plot_file: 0
    * plot_files: [0]
            0: file.pytor
    * rd_call: True
    * rd_call_mosaic: False
    * rd_circular_colors: ['#555555', '#aaaaaa']
    * rd_colors: ['grey', 'black', 'red', 'green', 'blue']
    * rd_manhattan_call: False
    * rd_manhattan_range: [0, 2]
    * rd_partition: True
    * rd_range: [0, 3]
    * rd_raw: True
    * rd_use_gc_corr: True
    * rd_use_mask: False
    * snp_call: False
    * snp_circular_colors: ['#00ff00', '#0000ff']
    * snp_colors: ['yellow', 'orange', 'cyan', 'blue', 'lime', 'green', 'yellow', 'orange']
    * snp_use_id: False
    * snp_use_mask: True
    * snp_use_phase: False
    * style: None
    * xkcd: False

cnvpytor> help markersize

markersize
    Size of markers used in scatter like plots (e.g. manhattan, snp).

TYPE
    float or str

DEFAULT
    auto

PLOTS AFFECTS
    manhattan, snp, region plot with snp panel

EXAMPLE(s)
    set markersize 10
    set markersize auto

SEE ALSO
    rd_colors, snp_colors, baf_colors, lh_colors

cnvpytor> set bin_size 100000
cnvpytor> chr1:1M-50M chr2:60M-65M > filename.png
> echo "rdstat" | cnvpytor -root file.pytor -view 100000 -o prefix.png

> cnvpytor -root file.pytor -view 100000 <<ENDL
set rd_use_mask
set markersize 1
set grid vertical
set output_filename prefix.png
manhattan
circular
ENDL

> cnvpytor -root file.pytor -view 100000 < script.spytor
CNVpytor will automatically store command line history into file ~/.cnvpytor/history if there is directory
~/.cnvpytor. To enable this functionality create this directory:
> mkdir ~/.cnvpytor
To configure viewer parameters create file viewer.conf within same directory in following format:
{
  'panels': ['rd', 'likelihood'],
  'snp_colors': ['orange', 'brown', 'green', 'blue', 'green', 'blue', 'orange', 'brown']
}
This way you can set any parameter using python syntax. Any parameter specified here will overwrite parameters provided in command line.
CNVpytor is not just command line tool but also Python package.
For more details check API Documentation or see examples in Jupyter notebook.
Please report any bugs that you find on GitHub: https://github.com/abyzovlab/CNVpytor/issues
Or, even better, fork the repository on GitHub and create a pull request.
Released under MIT licence.