Predicting weekly gross for Broadway theatres
Broadway theatre, or Broadway, are the theatrical performances presented in the 41 professional theatres, each with 500 or more seats, located in the Theater District and the Lincoln Center along Broadway, in Midtown Manhattan, New York City.
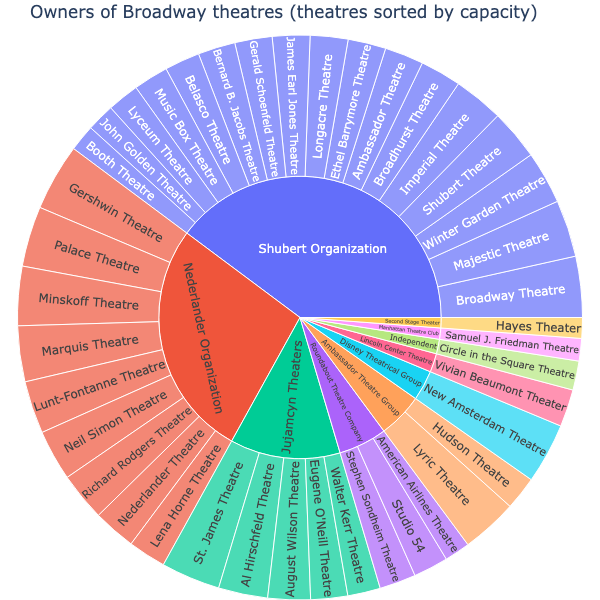
About 80% of the 41 theaters considered to be "on Broadway" are owned by 3 groups (see chart below). These groups have significant resources to allocate and how they decide to do so is an expensive question for them. It is plausible they are willing to expend a small amount of those resources to ensure they allocate large amounts in a prudent manner.
-
Theater-owning conglomerates (our main stakeholders) have an interest in accurate predictions of not just their annual box office gross for the coming year, but also how it is likely to fluctuate week-to-week (our main KPI), so they can budget accordingly. For example, if their cashflow is likely to plummet in a particular week, they want to anticipate this in order to keep enough cash on hand to maintain normal operations (e.g. making payroll). Alternatively, if they can anticipate high sales in a coming week, they can make arrangements for how to spend that money so it put to good use as quickly as possible (e.g. paying off a loan).
-
Playbill data offers valuable metrics such as the percentage of theatre seats sold weekly, which can inform decisions about maintenance scheduling, efficient workforce management, and other cost-saving measures.
-
Each theatre under a conglomerate has distinct attributes affecting its consumer appeal. As such, conglomerates might assign shows expected to perform well to their more appealing theatres. Therefore, separate models to predict each theatre's sales pattern individually would be beneficial.
-
The focus of the models in this context are the Gershwin and Majestic Theatres, chosen due to their data containing the least number of missing values. Significant week-to-week variation in the sales data makes imputation of missing values using traditional methods potentially problematic. Finally, because Gershwin and Majestic are owned by different conglomerates, the performance of the models can be evaluated against possible variations in sales patterns between the two theatres.
grosses.csv contains weekly box office grosses from playbill.com
For more information about the web scraping of this data please see https://github.com/rfordatascience/tidytuesday/tree/master/data/2020/2020-04-28
| variable | description |
|---|---|
| week_ending | Date of the end of the weekly measurement period. Always a Sunday. |
| week_number | Week number in the Broadway season. The season starts after the Tony Awards, held in early June. Some seasons have 53 weeks. |
| weekly_gross_overall | Weekly box office gross for all shows |
| show | Name of show. Some shows have the same name, but multiple runs. |
| theatre | Name of theatre |
| weekly_gross | Weekly box office gross for individual show/theatre |
| potential_gross | Weekly box office gross if all seats are sold at full price. Shows can exceed their potential gross by selling premium tickets and/or standing room tickets. |
| avg_ticket_price | Average price of tickets sold |
| top_ticket_price | Highest price of tickets sold |
| seats_sold | Total seats sold for all performances and previews |
| seats_in_theatre | Theatre seat capacity |
| pct_capacity | Percent of theatre capacity sold. Shows can exceed 100% capacity by selling standing room tickets. |
| performances | Number of performances in the week |
| previews | Number of preview performances in the week. Previews occur before a show's official open. |
We used the following data as our train and test data.
Train data: 5 years (2013-06-02 - 2018-05-27) Test data: 1 year (2018-06-03 - 2019-05-26)
We have tested several time series algorithms to arrive at our final model with varying levels of complexity.
The Autoregressive (AR) model is a time series analysis technique that models the relationship between an observation and a lagged version of itself. It assumes that the current value of a variable is linearly dependent on its previous values. In the AR model, the order of the autoregression, denoted as
where:
Using cross validation we found the best lag value. The selection process was based on the evaluation of the root mean square error (RMSE).
The Seasonal Autoregressive Integrated Moving Average (SARIMA) is an enhancement to the ARIMA model for handling seasonality. Like an ARIMA(p, d, q), a SARIMA model also requires (p, d, q) to represent non-seasonal orders. Additionally, a SARIMA model requires the orders for the seasonal component, which is denoted as (P, D, Q, S). Combining both components, the model can be written as a SARIMA(p, d, q)(P, D, Q, S).
We set S=52 (assuming yearly seasonality for our weekly data) and performed a naive grid search by evaluating different combinations of the (p, d, q) and (P, D, Q) parameters to pick the best model built using statsmodels's SARIMAX class.
We also used the auto_arima function from pmdarima library to optimize and find the best configuration for our SARIMA model. Prior knowledge about our data is key to obtaining the best results from auto_arima. Instead of the naive approach of training multiple models through grid search to cover every possible combination of parameter values, auto_arima automates the process for finding the optimal parameters. The auto_arima function uses a stepwise algorithm that is faster and more efficient than a full grid search or random search.
Although SARIMAX and auto_arima can give you good-performing models in many cases, they can be quite slow when you have long seasonal periods and a long time series. As a future direction to our project we consider exploring statsforecast, a relatively new library showing a lot of promise in having a fast implementation.
The Prophet model was developed by Facebook data scientists to make effective, flexible, and scalable business time series analysis accessible to individuals without significant experience or knowledge. Toward this end, it is designed to have parameters with effects that are intuitive to those without a thorough knowledge of the underlying mathematical model. The model has 3 main components: a function for non-periodic changes in trend g(t), periodic seasonality function s(t), and a parameter to account for irregularly-occurring holidays h(t). The trend component is a piecewise logistic growth function that saturates at a time-varying capacity C(t). The model attempts to automatically detect "changepoints" in the trend where the growth rate parameter (k) varies, but the user can also adjust this manually if their knowledge of the DGP gives them insight about potential trend changes or the absence thereof. Prophet has the ability to account for multiple levels of seasonality occurring simultaneously, though we did not need to make use of that feature for the present problem. The model incorporates each occurrence of a holiday as an independent indicator regressor with its own parameter for the change in forecast. While the prophet package includes built-in lists of most major holidays in each country, the US list did not correspond to the patterns in the data observed, so we manually built a custom list of holidays to use in our model. The holiday feature appeared to give the most significant added value relative to the other models, which, in contrast, typically were too conservative when estimating the size of holiday sales spikes.
In our comprehensive time series analysis on weekly Broadway sales grosses, we employed the Root Mean Square Error (RMSE) as the yardstick for evaluating the performance of our models. The RMSE provides an estimate of the average discrepancy between our model's predictions and the actual sales grosses. Essentially, a lower RMSE implies a model that is able to more accurately predict Broadway sales on a week-by-week basis. We trained and tested three distinct models: Autoregressive Model (AR), Seasonal Autoregressive Integrated Moving Average (SARIMA), and the Prophet Model. Their respective RMSE results were 382,071, 173,964, and 131,508, respectively, for the Gershwin Theatre. Based on these metrics, we selected the Prophet Model as our final model, as it achieved the lowest RMSE and an MAPE of 5.57%, which is plausibly accounted for largely by noise. Upon visualizing the forecasted time series on the test data, it was evident that the Prophet model's predictions closely adhered to the observed behavior. We strongly recommend the Prophet Model to our stakeholders. Not only does it adeptly handle seasonality and trends, but it also incorporates irregularities such as holiday spikes. This advanced level of precision offers a significant advantage for theater owners in forecasting their revenue. A reliable revenue estimate aids in efficient financial planning and expense management. Additionally, an accurate revenue prediction model can result in increased profitability by reducing the risk of over or under budgeting. This leads to optimized operations and potentially increased profitability.
| Errors | AR Model | SARIMA | Prophet |
|---|---|---|---|
| RMSE | 382071 | 173964 | 131508 |
| MAE | 260860 | 108365 | 98811 |
| MAPE | 0.137628 | 0.058077 | 0.0557 |
| Errors | AR Model | SARIMA | Prophet |
|---|---|---|---|
| RMSE | 167139 | 133343 | 93459 |
| MAE | 124601 | 101572 | 69875 |
| MAPE | 0.129 | 0.100935 | 0.0706 |
An interesting questions is: can one use external features to improve forecasts? In the context of SARIMAX model, which is the SARIMA model extended with the exogeneous features, we find the answer to be yes. We have chosen 'avg_ticket_price' and 'possible_gross' as exogeneous features. We find that for both theaters there are considerable improvements compared to SARIMA predictions. While performing forecast with the SARIMAX models, the future values for the exogenous features are assumed to be known. This is not totally unreasonable as 'avg_ticket_price' and 'possible_gross' are features that determined by the theatres, therefore the values of these features can be assumed to be known at least for the near future. Additionaly, SARIMAX models can be used to understand how exogenous features affect sales and therefore may guide the management. However, it is expected that a linear model is not sufficient for this purpose and non-linear effects need to be taken into consideration.
In conclusion, when it comes to predicting gross ticket sales for large Broadway theaters, the Prophet model outperforms both the AR model and SARIMA. The Prophet model's built-in fine-tuning capabilities and its ability to incorporate holiday effects make it particularly well-suited for accurately forecasting ticket sales in this context. By taking into account seasonality, trends, and special events such as holidays, the Prophet model can capture the complex dynamics of Broadway ticket sales and provide more reliable predictions.
For interactive plotting: https://facebook.github.io/prophet/docs/quick_start.html
For changepoint detection: https://facebook.github.io/prophet/docs/trend_changepoints.html
For modeling holidays: https://facebook.github.io/prophet/docs/seasonality,_holiday_effects,_and_regressors.html#modeling-holidays-and-special-events
For cross validation, diagnostic metrics, and hyperparameter tuning: https://facebook.github.io/prophet/docs/diagnostics.html
For explanation of the model: https://peerj.com/preprints/3190/