Pivot
Wiki ▸ API Reference ▸ Pivot Table
The function polyjs.pivot() takes a specification object spec and renders the graphic. This page explains the attributes that can be set through the spec object. The attributes fall into the following categories:
The three most important attributes are spec.columns, spec.rows and spec.values. They determine the data columns, rows, and values that would be used to generate the pivot table. These three attributes correspond to aesthetics in charts. Unlike aesthetics in charts, each of spec.columns, spec.rows and spec.values can map to more than one data series if necessary.
The image below illustrates how spec.columns, spec.rows and spec.values define a pivot table. In this example, there are two data series Column1 and Column2 that are mapped to spec.columns, one data series Row that is mapped to spec.rows, and one value mapped to spec.values.
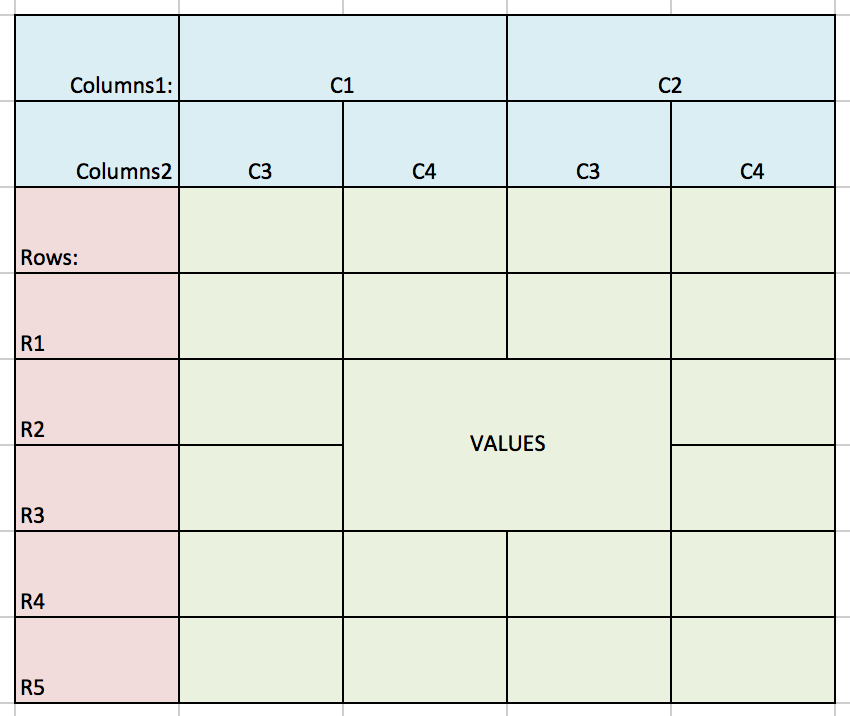
Note that you will need at least one row or column, and also one value, to properly render a pivot table.
| Type | Array of Aesthetic Mapping Objects |
| Statistical Aggregation | Not allowed |
| Binning of Continuous Data | Required |
Each data series mapped to spec.columns define the columns of the pivot table. As such, all continuous data columns should be binned, and no aggregate statistics should be used!
spec.columns = ["columnA", "columnB", {var: "columnC", sort: "someOtherValue"} ]
| Type | Array of Aesthetic Mapping Objects |
| Statistical Aggregation | Not allowed |
| Binning of Continuous Data | Required |
Each data series mapped to spec.rows define the rows of the pivot table. As such, all continuous data series should be binned, and no aggregate statistics should be used!
| Type | Array of Aesthetic Mapping Objects |
| Statistical Aggregation | Allowed |
| Binning of Continuous Data | Not Required |
These data series defines the values plotted in the center of the pivot table. All statistical aggregations should be here.
| Type | Polyjs Data Object |
| Required | Yes |
This should be a Polychart.js data object that is used to created the pivot table. See the data section of the API reference for more details.
| Type | Filter Object |
| Required | No (Optional) |
This is an optional attribute that could be defined if not all data points are to be visualized. See more at Filter.
| Type | String |
| Required | Yes |
A DOM element or an identifier of a DOM element to plot the pivot table in.
| Type | Int |
| Required | No (Optional) |
| Default | auto (as wide as required) |
The width of the pivot table in pixels.
| Type | Int |
| Required | No (Optional) |
| Default | auto (as high as required) |
The height of the pivot table in pixels.
| Type | Bool |
| Required | No (Optional) |
| Default | False |
Whether or not to plot rows and columns for which there is no data. For example, with the below data set:
c1 | c2 | v
------------
 A | C  | 1
 A | C  | 2
 B | D  | 2
...and column specification:
spec.columns =  ["c1", "c2"]
spec.rows =  []
spec.values =  ["sum(v)"]
...if spec.full is set to False (or default), then the below table will be rendered:
c1: |  A   |  B
-----------------
c2: |  C   |  D
-----------------
    |  3   |  2
...but if spec.full is set to True, then we will get:
c1: |      A      |     B     |
-------------------------------
c2: |  C   |  D   |  C  |  D  |
------------------------------
    |  3   |      |     |  2  |
Note that in the latter case, we get one column for each element in the cartesian product of all the columns.