Author: Peter Jensen
This is my first attempt at a 'useful' IoT project. I've had an Arduino Uno for a while, but didn't really use it for anything, except going through a blinking LED tutorial. It was time to bring it to use. I find it rewarding to think up a project idea and then seek out the information you need when you need it. Of course, often times you find that others have done something similar, but that's OK, you'll still learn from the process.
I wanted a device to measure power consumption in my house and have it report it up to a 'cloud' service when things changed; lights turning on/off, etc. Also, I wanted a display on the box, so I could read what the current power consumption was.
I started out by hooking up a current sensors to an analog input pin; like this:
Source: openenergymonitor.org
For calibration, I was using a multimeter that was capable of measuring up to 10A and hooked it up to a wire that was powering a three bulb lamp. Each of the bulbs could be turned on and off individually. With 60W bulbs in the sockets, I could get samples for 60W, 120W, and 180W.
Note, the current sensor must only go around one wire, in order for the AC current going through that wire to induce a current in the sensor.
The measured current is the current that goes through the power line that the current sensor wraps around.
If all you do in the loop() function in your Arduino sketch is to call analogRead() and store the result away in a memory buffer, you will be able to get about 100 samples during one cycle (60Hz - 16.7ms). The Arduino is running at 16MHz. That should be enough to compute the root-mean-square (rms) value of the input fairly accurately.
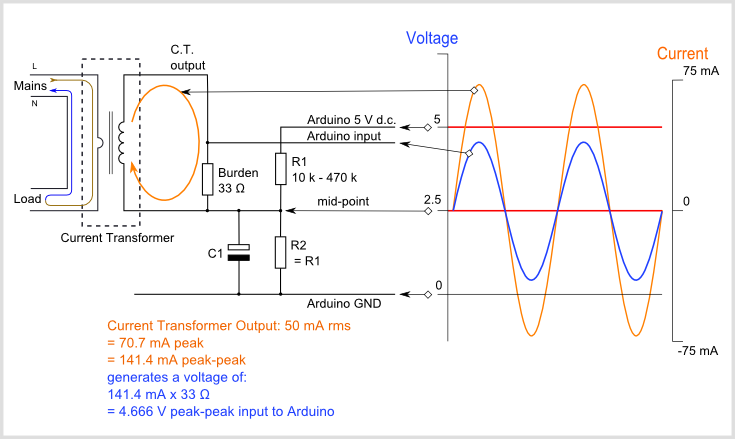
Why do you need the rms value? The input on the analog input pin is the voltage drop over the load/burden resistor. That voltage drop is directly proportional with the current going through the power line being measured at the time of measurement.
When the current and voltage are varying over time, the power is computed as the average power over the period of the 60Hz sinus wave, using the RMS values of I and V:

The VRMS component is kept constant by the power company at 120V, so the interesting one is the IRMS value. The Arduino analog-to-digital converters are 10-bits, and the circuitry is designed so that the mid-point of the sinus input is 2.5V, which should result in a reading of ~511. If the readings are equally spaced in time, the IRMS value can be computed as:

where N is the number of samples it take to cover the full period of the 60Hz sinus wave, K is a calibration constant that will be determined after measuring the actual IRMS values with a multimeter, and vi are the values returned by the calls to analogRead()
More info on the math can be found here: wikipedia
<TODO: Insert picture of test measurement setup>
I bought everything I needed on Amazon Prime. If you're not a Prime subscriber you might end up paying a bit more. For some items, it made sense to buy more than one unit, since it was only a few dollars more and it's always nice to have a spare in case you fry one. Also, if you want to make a second (or third) unit you already have what you need.
| Item | Total Cost | Unit Cost |
|---|---|---|
| Arduino Pro Mini (3-pack) | $11 | $4 |
| 3.3V/5V Power Supply Module (5-pack) | $9 | $2 |
| ESP8266 Esp-01 (4-pack) | $14 | $4 |
| 2x SCT-013-000 Non-invasive AC Current Sensor | $26 | $13 |
| 16x2 LCD Display Module | $6 | $6 |
| 110VAC->9V Adapter | $6 | $6 |
| 10pcs 4x6cm Double Side Prototype PCB | $7 | $1 |
| 10pcs 3.5mm female PCB mounted jacks | $8 | $2 |
| Misc: Capacitor, resistors, button, wires | ~$2 | $2 |
| Total | $89 | $40 |
Here's how I wired everything together:

I used the Digikey Scheme-it software to create the hardware wiring diagram above. It runs in a browser!
There's a few things to point out:
- The power supply unit can take an unregulated input voltage (6.5 - 12V), or USB input power. The 5V supply is used for the Arduino and the 3.3V is used for the ESP8266.
- I opted not to use a an I2C 16x2 LCD display, because there were enough I/O pins available on the Arduino to drive it directly, and not having the I2C circuitry saves a little power.
- The CT1 and CT2 'inductor' like symbols represent the SCT-013 current sensors
- The 2, 3, 4, and 5 input pins on the Arduino are attached in reverse order. This just makes the diagram look a bit nicer.
The information shown on the 2 line LCD cycles through this information, when the button is pressed:
- Total Power
- Line Power
- Total Current
- Line Current
- Total Energy Usage
- Local IP address
- Advanced Options - <<Long Press>>
If a long press is detected when 'Advanced Options' is shown these additional screens are included in the rotation:
- WiFi Transmit - On/Off
- Samples Transmit - On/Off
- Reset Data
In order to change the On/Off status or reset the data a long press on the button must be performed.
 Total Power Total Power |
 Line Power Line Power |
 Line Current Line Current |
 Total Energy Use since last reset Total Energy Use since last reset |
 Local IP Address Local IP Address |
 Long Press for Advanced Options Long Press for Advanced Options |
 WiFi transmission on/off WiFi transmission on/off |
 Transmit each sample value Transmit each sample value |
 Transmission in progress Transmission in progress |
The browser display/interface currently looks like this:

The black and red lines represent the power drawn from each of the two phases coming into the house. The left and right arrow buttons on top will go to the previous day or the next day. If you're at todays day, new data will be fetched. No need to hit 'refresh'!
Here's some of the things that can be derived from this:
-
The 'black' standby consumption is roughly 125W, and the 'red' one is 25W. This is the parasitic draw by all the devices that are in standby mode (TV, microwave, computers, webcams, etc)
-
The up/down square pattern on the 'black' line is the compressor in the fridge turning on and off.
-
I woke up around 6am and started turning lights and the TV on. The TV is drawing from the 'black' line.
-
The spike in the 'red' is my CO2 fan on my water heater. The water heater runs for about 10 minutes
-
The smaller spike after the water heater spike is the garage door opening.
I used openSCAD to design a box. The .scad file and rendered .stl files are in this repo. The box with the cutouts for the display, button, and various connectors looks like this:

- Use an OLED 128x64 display instead
- Use an ESP32 module instead
- More inputs (lower amps)
- Better fault toleracy (after power outage)
- Turn off the LED backlight after inactivity
-
Flaky power supply
Relying on the power supply from the USB caused some flakiness in the analog pin readings. Also, in order to supply power to the ESP-01, I needed a 3.3V supply. The Arduino Pro Mini doesn't have a 3.3V voltage regulator, like the Uno does. The very inexpensive power supply module fit the bill, and seems to deliver a stable enough power to ensure stable readings.
-
Baud rate of ESP8266 ESP-01
I had to use a couple of digital I/O pins on the Arduino for the serial communication between the Arduino and the ESP-01 module. The regular TX/RX pins are needed for flashing the software onto the Arduino. When using the SoftwareSerial module with digital I/O pins it wasn't possible to get a reliable communication link to the ESP-01 at the default 115200 baud rate. Since the amount of data exchange between the Arduino and the ESP-01 is fairly limited I set the baud rate to a safe 9600 baud.
-
Running out of memory on the Arduino
The Arduino has only 2K worth of RAM memory. The RAM is used for all global data, stack data, and even constant string data. The Atmel 328 gcc compiler does a good job eliminating all dead code and data, and I'm pretty amazed that you can actually run a 1000+ lines C++ program in that small amount of RAM. It does take some fiddling to make it fit though.
- Avoid using the
newoperator to allocate objects: - Move all strings to flash memory:
- Avoid using
Stringobjects: - Insert probes to check the stack usage:
- Use smaller integers whenever possible:
- Avoid using the
 Top view
 Power supply connectors
 CT connectors
 Antenna part of the ESP8266
 Bottom view
 Bottom view without Arduino
 Bottom view without Arduino and ESP8266
 Button and LCD attached to the top
 PCB underside
 Box with lid
here's some code
Here's a table:
|1|2| | | | |adadf|adfadf|