Home
servo v. : WATCH OVER, OBSERVE
Latin.
Servo provides a simple interface for exposing and publishing application metrics in Java. The primary requirements are:
- Leverage JMX: JMX is the standard monitoring interface for Java and can be queried by many existing tools.
- Keep It Simple: It should be trivial to expose metrics and publish metrics without having to write lots of code such as MBean interfaces.
- Flexible publishing: Once metrics are exposed, it should be easy to regularly poll the metrics and make them available for internal reporting systems, logs, and services like Amazon's CloudWatch.
This has already been implemented inside of Netflix and most of our applications currently use it.
To give you an idea of how much work is involved to expose metrics to JMX using servo, here is an example of a simple server class with a few metrics:
public class Server {

    @Monitor(name="Status", type=INFORMATIONAL)
    private AtomicReference<String> status = new AtomicReference<String>("UP");

    @Monitor(name="CurrentConnections", type=GAUGE)
    private AtomicInteger currentConnections = new AtomicInteger(0);

    @Monitor(name="TotalConnections", type=COUNTER)
    private AtomicInteger totalConnections = new AtomicInteger(0);

    @Monitor(name="BytesIn", type=COUNTER)
    private AtomicLong bytesIn = new AtomicLong(0L);

    @Monitor(name="BytesOut", type=COUNTER)
    private AtomicLong bytesOut = new AtomicLong(0L);

    // ...
}
Once you have a class with annotated metrics, you must register a particular instance of it with a registry:
Server s1 = new Server();
Monitors.registerObject("s1", s1)
For complete code see the provided examples.
There are two annotations that can be used to mark up a class:
- MonitorTags: Indicates a set of tags that should be added to all annotated fields in the class. Like MonitorId it can be set when an instance is created to allow for dynamic tags where tags provided in the Monitor annotation can only be set at compile time.
-
Monitor: This is the annotation that is used on a field or method to indicate that the value should be exposed. These values will be collected from a background thread so you should take care that the access is thread-safe. If the data source type is
GAUGEorCOUNTERthe value must be numeric. Annotated methods should be fast and avoid potentially costly operations such as IO so that data can be collected reliably.
- GAUGE: A gauge is a numeric value that can be sampled and reported as is, for example, the number of clients that are currently connected to a server.
- COUNTER: A counter is a numeric value that gets incremented when some event, such as a client connecting to a server, occurs. When reported to monitoring systems, a counter will typically be converted to a rate of change by comparing two samples. Counter values should be monotonically increasing.
- INFORMATIONAL: An informational value is for non-numeric data that might be useful to view in JMX, but will not be reported to monitoring systems.
A monitor registry is used to keep track of objects that should be monitored. Unless an instance is registered it will not be viewable in JMX. Two registry implementations are provided:
-
DefaultMonitorRegistry: A singleton that forwards all calls to another registry class. The registry class used can be customized by setting the system property
com.netflix.servo.DefaultMonitorRegistry.registryClass. By default a JmxMonitorRegistry will be used. - JmxMonitorRegistry: Registry that exports objects to JMX.
When using the JmxMonitorRegistry the metrics will be registered with a domain name of com.netflix.servo.jmx.MonitoredResource and will have the following key properties:
- class: The canonical class name of the annotated object.
- instance: Optional, will be set to the MonitorId if one is specified on the object.
- field: For each object there will be two fields: metadata and value. Metadata is a compound type with the information from the annotation. Value is a simple type showing the current value of the annotated field or method.
We chose to separate the metadata and value for two reasons:
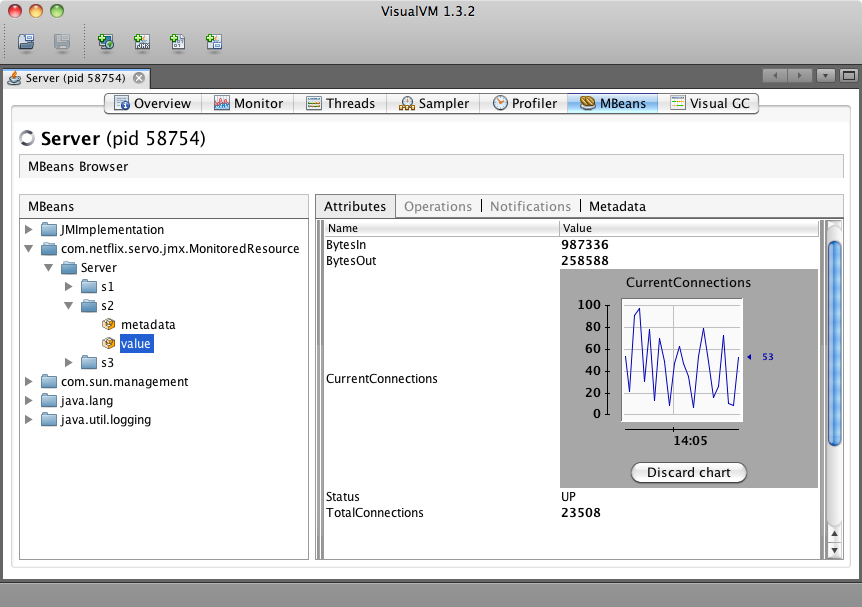
- Many tools work better for simple types, for example, you can double click on a simple type in VisualVM to get a graph of the value over time.
- We wanted to be able to filter metrics based on the metadata without invoking the annotated method. This can be important if an annotated method is poorly implemented and needs to be ignored so it does not impact the collection of other metrics.
Metrics can be viewed using tools for accessing JMX data like VisualVM:
Once metrics are registered, they can be polled and published to various sources. The servo library provides three main interfaces for collecting and publishing data:
- MetricObserver: An observer is a class that accepts updates to the metric values. Implementations are provided for keeping samples in memory, exporting to files, and exporting to CloudWatch.
- MetricPoller: A poller provides a way to collect metrics from a given source. Implementations are provided for querying metrics associated with a monitor registry and arbitrary metrics exposed to JMX.
- MetricFilter: Filters are used to restrict the set of metrics that are polled. The filter is passed in to the poll method call so that metrics that can be expensive to collect, will be ignored as soon as possible. Implementations are provided for filtering based on a regular expression and prefixes such as package names.
Here is an example for how to collect all metrics from the DefaultMonitorRegistry once a minute and record them to a local file:
PollScheduler scheduler = PollScheduler.getInstance();
scheduler.start();

MetricObserver fileObserver = new FileMetricObserver("stats", directory);
MetricObserver transform = new CounterToRateMetricTransform(
    fileObserver, 2, TimeUnit.MINUTES);
PollRunnable task = new PollRunnable(
    new MonitorRegistryMetricPoller(),
    BasicMetricFilter.MATCH_ALL,
    transform);
scheduler.addPoller(task, 1, TimeUnit.MINUTES);An observer is a class that receives metric updates at a regular interval. The following observer implementations are provided in the core library:
- MemoryMetricObserver: Keeps the last N updates in memory. Useful for debugging and test cases where you want to check that the correct set of metrics were published.
- FileMetricObserver: Stores updates to files on disk. This can be used as an easy way to log the metric values on an instance for later analysis.
- AsyncMetricObserver: Wrapper around another observer that returns immediately and sends the update to the downstream observer asynchronously in a background thread. This should be used if the downstream observer may be unreliable or slow. The behavior can be tuned by specifying a max queue size and max delivery time. If the queue fills up newer updates will overwrite older updates. The max delivery time is to ensure that an update is processed within a given window or it is dropped.
To publish data, a poller class is called at a regular interval and the data is passed on to an observer.
- MonitorRegistryMetricPoller: Fetches metrics from a monitor registry.
- JmxMetricPoller: Fetches arbitrary data from JMX such as Java Platform MBeans or MBeans from a container such as Tomcat.
- CompositeMetricPoller: Wraps a set of metric pollers that should all be polled. You can control how many threads are used for collecting data from the wrapped pollers as well as place time limits to prevent a single slow poller from impacting all metrics.
To collect JMX metrics you just need to create a JmxMetricPoller instance with an appropriate ObjectName pattern and a filter that is used to select the counters. The poller will try to match all values with simple numeric types. Boolean data will also be collected and recorded as a 1 if the value is true and 0 if the value is false. The poller will try to recursively search CompositeType values to extract numeric data. The returned metrics will have the following tags:
- JmxDomain: Domain used in the object name.
- Jmx.${propKey}: For each property in the object name a tag will be created. The tag key will be the same as the property key with a prefix of Jmx. and the value is the property value.
- JmxCompositePath: For CompositeType objects this tag is added to indicate the precise value that was extracted. The path is just the key name at each level joined with a period.
Filtering is used select the precise set of metrics that you want sent to different observers. For example, it may be useful to have many metrics exposed in JMX, but you only want to publish a small subset to an external system like CloudWatch that charges per metric. The following filter implementations are provided:
- BasicMetricFilter: A simple filter that always returns true or false.
- PrefixMetricFilter: A filter that will delegate to a sub-filter based on the longest matching prefix for a given tag value. This can be useful for filtering based on class names, for example filtering out all metrics from a given package.
- RegexMetricFilter: A filter that checks if a tag value matches a regular expression.
Typically the current value of a counter is not very useful, what is important is how the value changes within a given period of time. Servo provides a transform class to convert counter values into a rate per second before the value is passed on to a downstream observer. The rate is calculated by comparing two samples of a given metric and looking at the delta. Since two samples are needed to calculate the rate, no value for a metric will be sent to the wrapped observer until a second sample arrives. If a given metric is not updated within a given heartbeat interval, the previous cached value for the counter will be dropped such that if a new sample comes in it will be treated as the first sample for that metric. The heartbeat should typically be some small multiple of the sampling interval.
Counters should be monotonically increasing values. If a counter value decreases from one sample to the next, then we will assume the counter value was reset and send a rate of 0. This is similar to the RRD concept of type DERIVE with a minimum of 0.
Publishing to CloudWatch can be done by sending metrics to a CloudWatchMetricObserver, for example:
MetricObserver cwObserver = new CloudWatchMetricObserver(
    "ObserverName",
    "MyCompany/CloudWatchDomain",
    new PropertiesCredentials(credentialsFile));
// Setup filters and register with schedulerComplete examples are provided as part of the source, see:
- Core examples
- Flux Capacitor -- a more realistic example using many Netflix OSS components.
You can easily run the examples using maven, for example to run BasicExample:
$ ./gradlew :servo-example:run
- Stackdriver Integration -- StudyBlue maintain a library that enables publishing custom Servo metrics to Stackdriver.