The cellular Human Protein Atlas (HPA) is a database of protein spatio-temporal localization in human cells. The localization annotations rely on manual categorization based on reliability scores. Such scores are curated to indicate the reliability of the available data from the Human Protein Atlas and UniProtKB databases, encompassing:
- reproducibility;
- correlation with RNA expression;
- literature support's consistency;
- ??
Localization annotation relies mainly on antibody-based immunofluorescence confocal microscopy with the following possible annotations:
- nuclear membrane;
- nucleoli;
- nucleoli fibrillar center;
- nucleoplasm;
- nuclear speckles;
- nuclear bodies;
- nucleus;
- actin filaments;
- intermediate filaments;
- microtubules;
- centrosome;
- microtubule organizing center;
- cytosol;
- rods and rings;
- mitochondria;
- endoplasmic reticulum;
- Golgi apparatus;
- plasma membrane;
- secreted proteins;
- endosomes;
- lipid droplets;
- lysosomes; and
- peroxisomes.
CAPSULE is an R package to parse and visualize HPA cell data. It has the following dependencies:
- R >=3.5;
- XML 3.98-1.16;
- stringr 1.3.1;
- tibble 2.0.1;
- biomaRt 2.38.0;
- grImport 0.9-1.1; and
- rsvg 1.3.
To prepare for data analysis, download and extract subcellular_location.tsv.zip (1.2Mb) in a sister folder called * data *. This is a tab-delimited file with the following parameters:
- Gene: Ensembl 88.38 gene identifier based on the GRCh38.p12 human genome assembly (GCA_000001405.27). The GRCh38.p12 was last updated and patched in January 2017.
- Gene name: common name of the gene given the Ensembl gene identifier.
- Reliability: gene reliability score:
- Enhanced: enhanced locations; 1+ antibodies validate the location without contradiction.
- Supported: supported locations; reported in the literature but not at the level of enhanced validation.
- Approved: approved locations; protein's localization was detected using only one antibody without additional validation.
- Uncertain: uncertain locations; inconclusive evidence: no RNA expression detected or contradiction between antibody-stains and experimental data.
- Single-cell variation intensity: variation in protein intensity at the single-cell expression level (as detected via indirect immunofluorescence staining);
- Single-cell variation spatial: variation in the spatial distribution of the protein (detected via indirect immunofluorescence staining)
- Cell cycle dependency:locations with observed cell cycle dependency
- GO id: gene ontology cellular component term identifier
In scriptTemplate.R, there are defined functions to clean, parse, and map HPA data to other data sources. We will use parseHPAData() first that takes the filepath to the TSV file as well as an optional reliability argument as parameters. The reliability parameter filters the HPA dataset by the reliability category of interest. By default, it is set to "enhanced", with other options being "approved", "supported", and "uncertain".
source("./inst/scripts/scriptTemplate.R")

filepath = "./data/subcellular_location.tsv"
enhanced <- parseHPAData(filepath) # a function defined in scriptTemplate.R
head(enhanced)
Gene Gene.name Enhanced Single.cell.variation.intensity Single.cell.variation.spatial Cell.cycle.dependency GO.id
NFYA ENSG00000001167 NFYA Nucleoplasm Nucleoplasm (GO:0005654)
CYP51A1 ENSG00000001630 CYP51A1 Endoplasmic reticulum Endoplasmic reticulum (GO:0005783)
BAD ENSG00000002330 BAD Mitochondria Mitochondria (GO:0005739)
RBM5 ENSG00000003756 RBM5 Nucleoplasm Nucleoplasm (GO:0005654)
FKBP4 ENSG00000004478 FKBP4 Cytosol;Nucleoplasm Cytosol (GO:0005829);Nucleoplasm (GO:0005654)
KDM1A ENSG00000004487 KDM1A Nucleoplasm Cytosol (GO:0005829);Nucleoplasm (GO:0005654)
hgnc_symbol external_gene_name chromosome_name refseq_peptide
NFYA NFYA NFYA 6 NP_002496
CYP51A1 CYP51A1 CYP51A1 7 NP_000777
BAD BAD BAD 11 NP_004313
RBM5 RBM5 RBM5 3 NP_005769
FKBP4 FKBP4 FKBP4 12 NP_002005
KDM1A KDM1A KDM1A 1 NP_001350583
Here, in addition to the parameters of the HPA TSV file, hgnc_symbol external_gene_name chromosome_name refseq_peptide were the mapped attributes in the ENSEMBL biomaRt for each ENSEMBL ID. This is to resolve usage of withdrawn and obsolete gene names and IDs in the HPA database.
Working with the parsed HPA dataset is straightforard now. One can subset, index, tabulate, etc. as one would with dataframes. Note, however, that the HPA dataset stores its data as factors.
# break up grouped annotations to get unqiue counts
loci <- unlist(strsplit(as.character(enhanced$Enhanced), ";"))

par(las=2) #align bar labels horizonatally
par(mar=c(4,15,0,1)) # set margins of the plot space
barplot(table(loci), horiz = TRUE, cex.names = 0.8, cex.axis = 0.8)
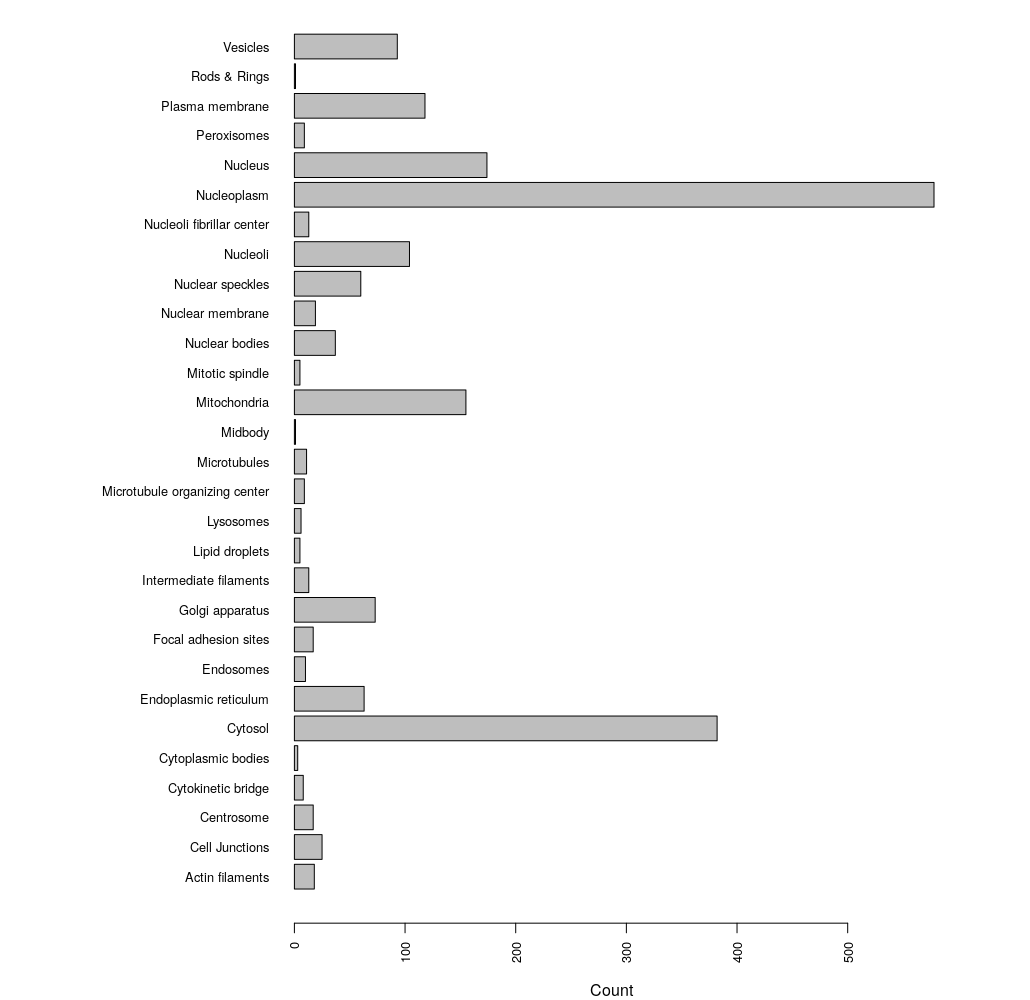
We can see that the most abundant localization annotation in our enhanced HPA dataset is the Nucleoplasm.
The Human Protein Atlas also provides an SVG of their protoypical cell. Using Chrome download for some reason disallows recognition of this SVG as a vector graphic by grImport functions. In an image editor, the provided SVG was re-exported as SVG and edited in a text editor to remove whole cell masking. The final image in inst/extdata/ is compatible with grImport.

whereIs("DVL2", enhanced, "Enhanced") #will highlight cellular components in black
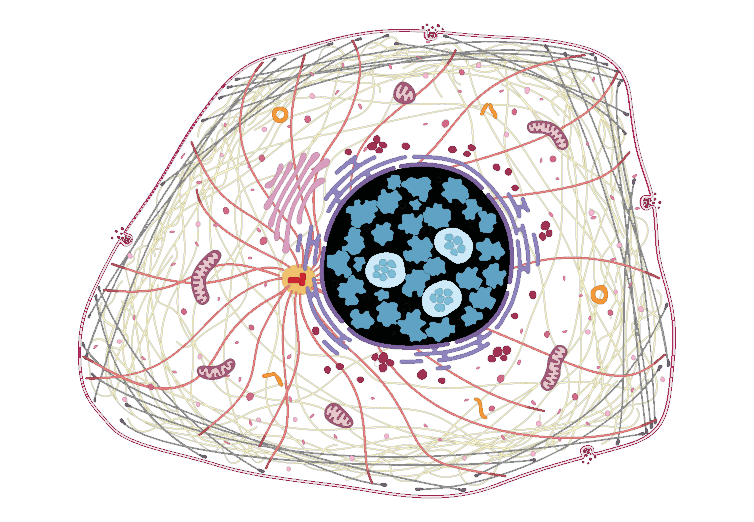
which maps to ...
unlist(strsplit(as.character(enhanced["DVL2",]$Enhanced),";"))
[1] "Nuclear bodies" "Nucleoplasm"
Thul, F., et al.. (2017) A subcellular map of the human proteome. Science 356(6340): eaal3321. DOI: 10.1126/science.aal3321