![]()


Implementation of path finding algorithms including:
- Depth-First Search (DFS)
- Breadth-First Search (BFS)
- Dijkstra Search
- Greedy Best-First Search
- A*
- D*-Lite
- Jump Point Search (JPS)
pip install pathfindDefine a graph to transform graph from a matrix, then find a path from start point to end point. The value in m
indicates a cost at that node. Note that the -1 in m represents the cost in that node is infinity, which means this
node is not connected to others.
import pathfind

m = [
    [1, 1, 1, 1, 1],
    [1, 2, -1, 1, 1],
    [1, 1, 1, 1, 1],
    [8, 3, 1, 1, 1],
    [1, 1, 1, 1, 1],
]
graph = pathfind.transform.matrix2graph(m)
path = pathfind.find(graph, start="4,0", end="0,0")
# ['4,0', '4,1', '3,1', '2,1', '2,0', '1,0', '0,0']

graph.show(trace=path)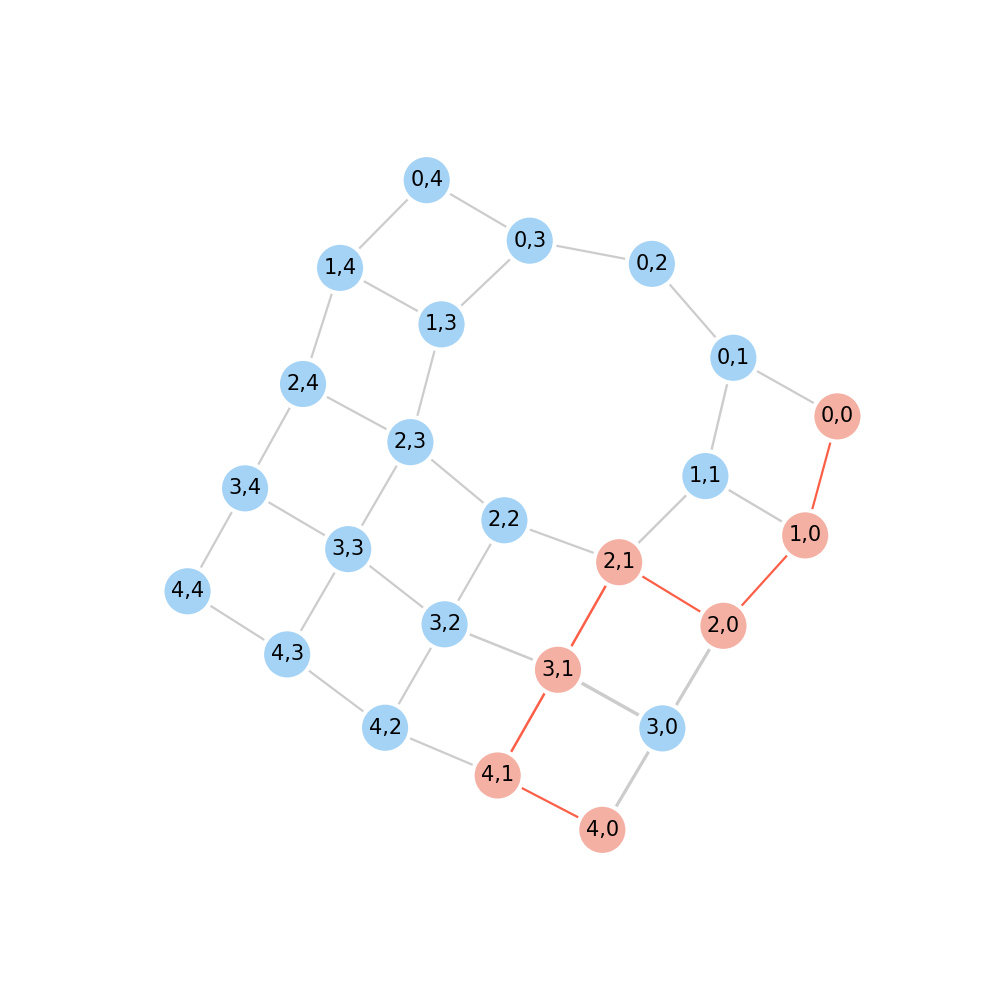
Finder can be changed by passing a string method ("a*", "bfs", "greedy", "dijkstra", "dfs", "d*lite", "jps").
path = pathfind.find(graph, start="2,2", end="0,2", method="bfs")
# ['2,2', '2,1', '1,1', '0,1', '0,2']

graph.show(trace=path)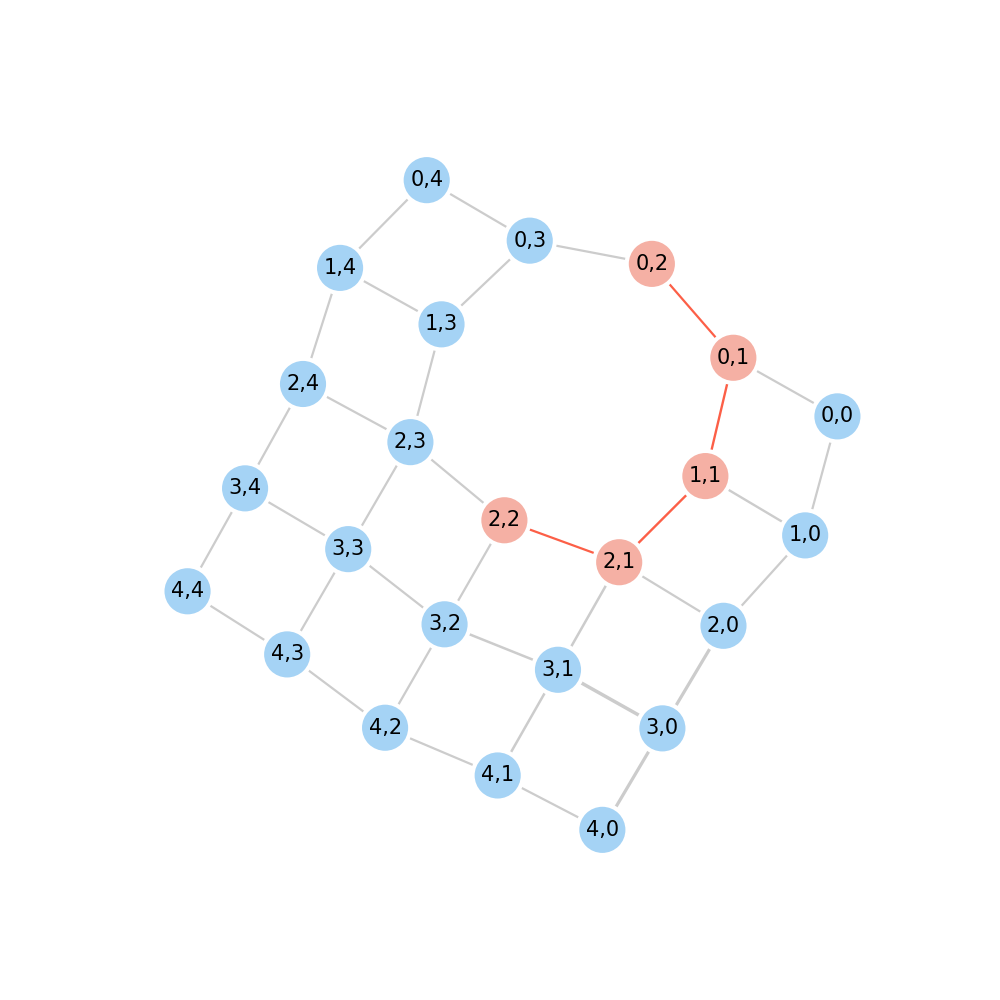
Another way to define a graph is to config the edge by give [node1's name, node2's name, cost] pairs.
import pathfind

conf = [
    # [node1's name, node2's name, weight, *back_weight]
    ["n1", "n2", 0.1],
    ["n1", "n3", 0.2],
    ["n2", "n3", 0.3]
]
graph = pathfind.Graph(conf)
graph.show()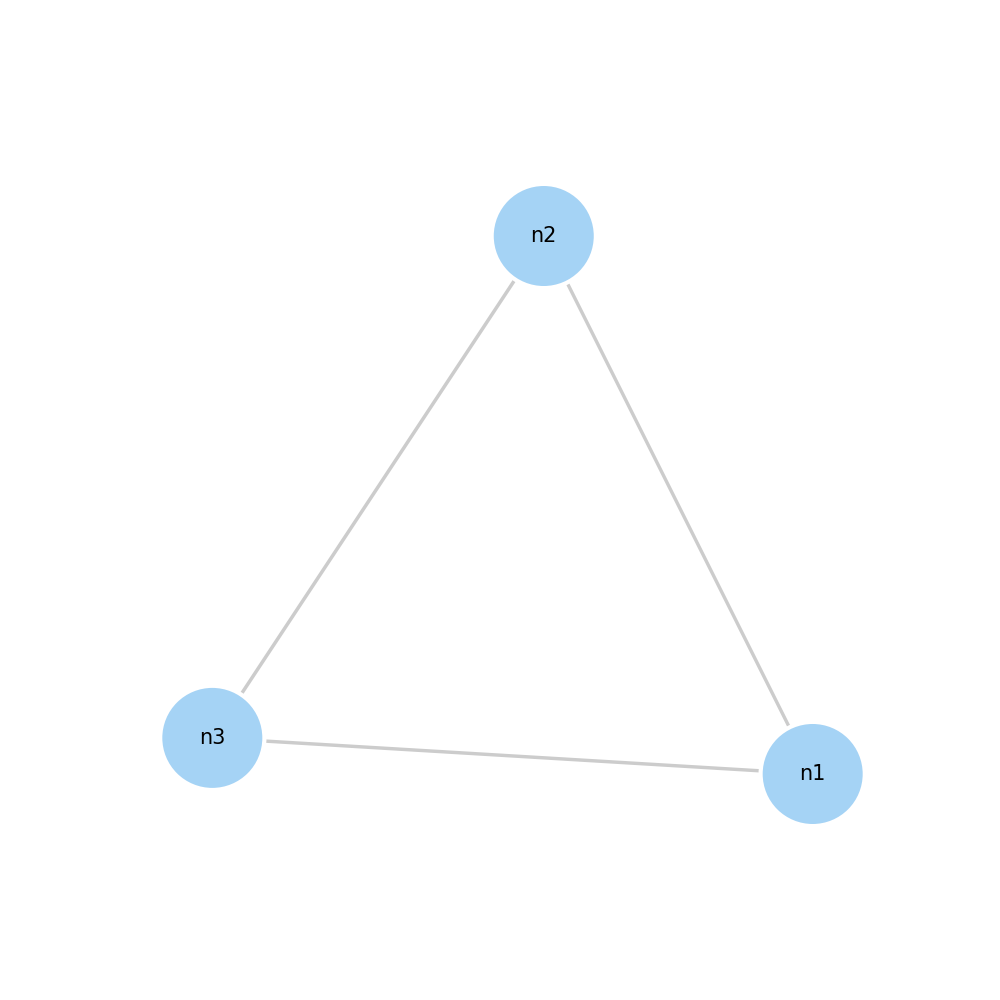
Or you can set edge's and node's details by following way:
import pathfind

my_n0 = pathfind.Node(name="my_n0")  # node name set to "my_n0"
auto_name = pathfind.Node()  # node name automatically set to "n0"
n2 = "n2"  # pass a string to represent node name
e0 = pathfind.Edge(node1=my_n0, node2=auto_name, route_weight=0.2)
e1 = pathfind.Edge(node1=my_n0, node2=n2, route_weight=0.1)
e2 = pathfind.Edge(auto_name, n2, route_weight=0)

g = pathfind.Graph()
g.add_edges([e0, e1, e2])
g.show()
g.edges
"""
{'my_n0:n0': my_n0:n0, 'my_n0:n2': my_n0:n2, 'n0:n2': n0:n2}
"""
A diagonal grid graph can be generated by following way:
import pathfind

m = [
    [1, 1, 1, 1],
    [1, 1, 1, 1],
    [1, 1, 1, 1],
]
graph = pathfind.transform.matrix2graph(m, diagonal=True)
path = pathfind.find(graph, start="0,0", end="2,3")
# ['0,0', '1,1', '2,2', '2,3']

graph.show(trace=path)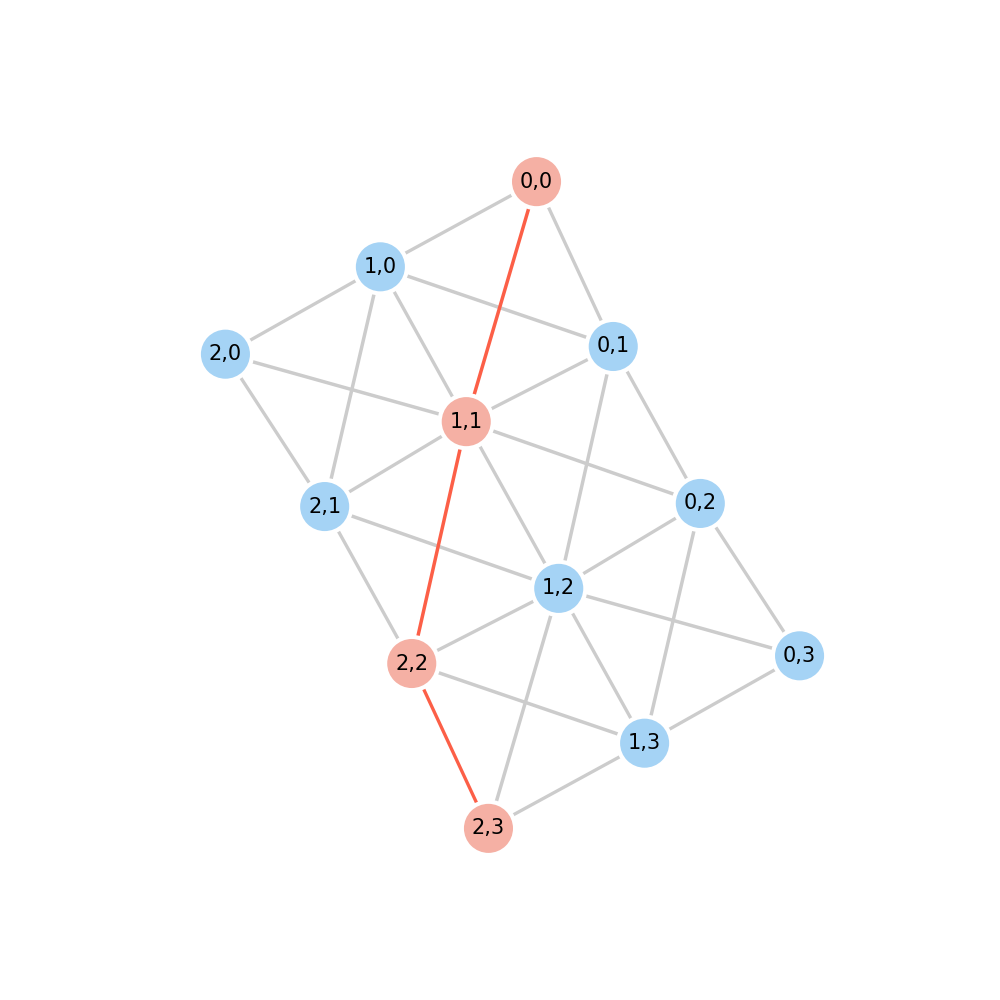
More examples and usages can be found in test