Queries and reports to visualize your SQL data and transaction log page allocations.
See which pages are reserved for which objects, and which pages are not used.
Server
Specifies the SQL Server instance to connect to.
Database
Specifies the database name which you wish to analyze.
The minimum permissions that are required to see this report are:
VIEW DATABASE STATEpermission in the database.CREATE DATABASE,ALTER ANY DATABASE, orVIEW ANY DEFINITION.
- The compact report uses the
sys.dm_db_database_page_allocationssystem function which is undocumented and not officially supported. It was introduced in SQL Server 2012 and later. - The detailed transaction log report uses the
sys.dm_db_log_infosystem function which was only introduced in SQL Server 2016 SP 2 and later. - The detailed data report uses the
sys.dm_db_page_infosystem function which was only introduced in SQL Server 2019 and later. - The detailed data page report outputs detailed data on the page level. Therefore, if you're querying from a very large database, keep in mind that generating the reports could take a very long time.
At this time, these are the report types included:
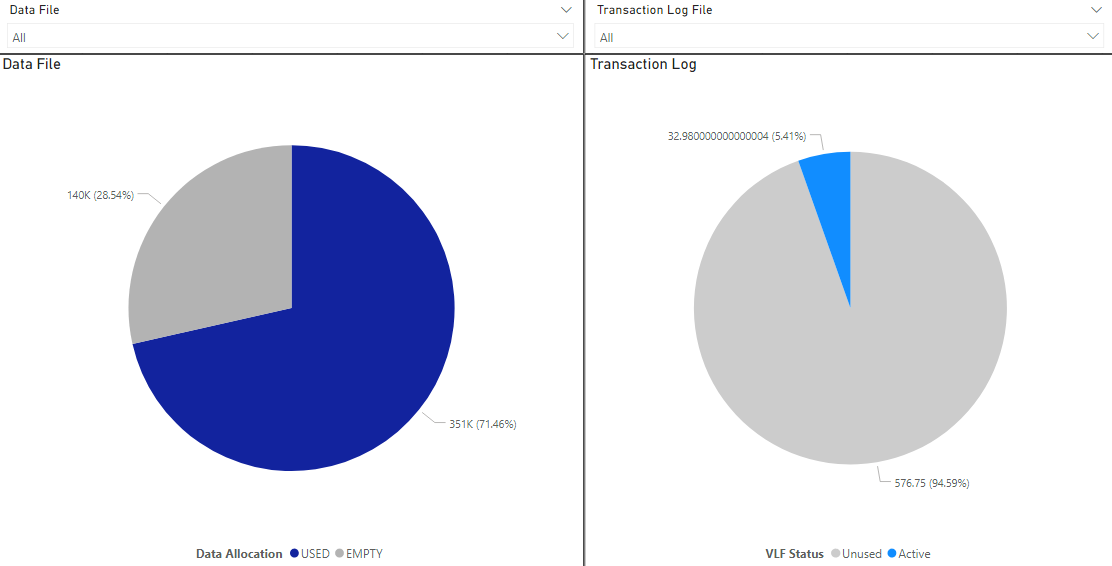
This report is a summary free/used report for your data and log files.
You can use the data slicers to filter by specific data or log files (if you have more than one in your database). The filters will affect all other pages.
This report displays your biggest continuous USED / EMPTY pages in your data file.
Each bar in this report represents a continuous range of pages, and its height represents the number of pages in that range.
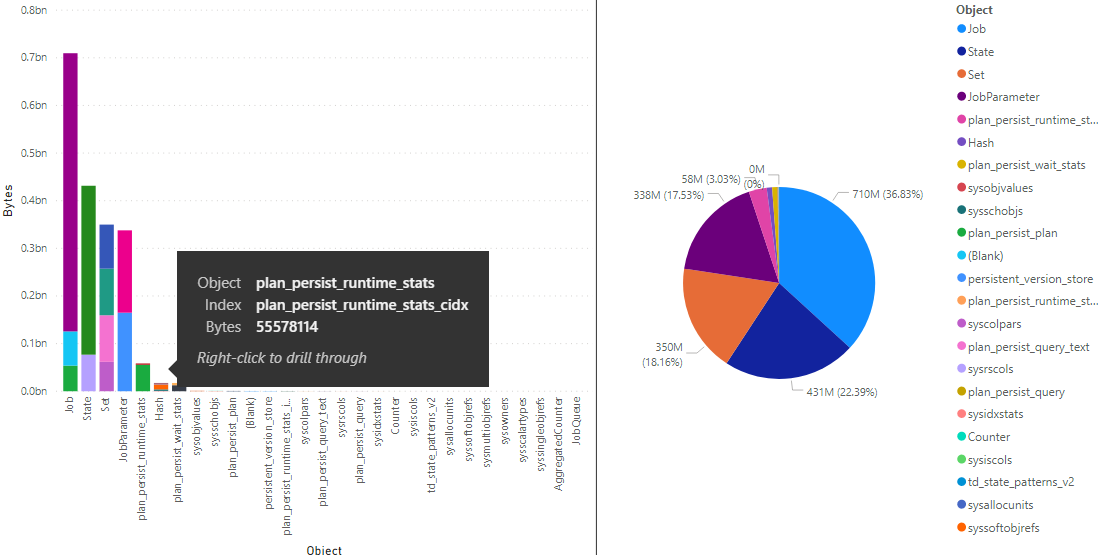
This report summarizes the data utilization of your database objects.
You can use this report to drill-through to the detailed page report.
This report displays your data file's contents per each data page.
It shows you the page allocation type (DATA / INDEX / LOB / IAM / EMPTY / etc.), and also the object and index it belongs to.
This report displays your transaction log file's contents, highlighting the active / non active VLFs.
Additional plans for future development:
- Additional report formats besides Power BI (e.g. Qlik, Reporting Services, Power Pivot, etc.)
This is an open-source project licensed under the MIT license.
You are more than welcome to contribute by forking this project and making improvements and adding features.
If you wish to develop these reports for a new platform, please create a separate folder for it.


