
User-friendly Graphical User Interface (GUI) developed at the National Institute for Materials Science (NIMS) for performing statistical data analysis, machine learning (ML) modelisation, and composition/process optimisation through Bayesian optimisation.
Can be used directly with the link below:
If you are looking for the local version:
-
Executable available on https://madgui.odoo.com/ for both Windows and Mac.
-
Here local_version section for the local version using the code on GitHub.
Streamlit app: https://lambard-ml-team-madgui.streamlit.app/
Code accessible on GitHub:
GitHub page: https://github.com/Lambard-ML-Team/MADGUI
Christophe BAJAN* & Guillaume LAMBARD*
*National Institute for Materials Science, Tsukuba, Japan
We have developed MADGUI, a Multi-Application Design Graphical User Interface that require no programming knowledge and can be applied to a wide range of fields. This GUI is built using Python and various python libraries including Streamlit, scikit-learn, seaborn, xgboost and more importantly GpyOpt for the Bayesian Optimisation (BO) part. BO is a probability model that find the minimum/maximum of a black-box function (objective function) using a prior function based only on the data collected and performing multiple iterations. The goal of MADGUI is to help researchers to reach the optimum parameters in their research.
The following parts are the explanation of how to use the GUI.

Firstly, to use correctly the GUI you need to have a tabular dataset with some specifications. There is some rules to follow:
- Only numerical values
- No empty space
- Format csv or xlsx
- First line must be columns names (features and targets)
- Dataset must be in the first sheet of your file
The dataset contains 12 columns, 8 were created by the Scikit-learn’s function (1 is just the indentation of samples, 4 are informative’s features (Feature_1 to Feature_4) and 3 targets (Target_1 to Target_3)), and we built 4 columns for the demonstration as follow:
- Feature_build1 to display the positive linear correlation: Feature_build1 = Feature_1 + 2
- Feature_build2 to display the negative linear correlation: Feature_build2 = - Feature_2 + 2
- Feature_build3 to display the constraint functionality: Feature_build3 = 2 - (Feature_3 + Feature_4)
- Feature_build4 to display the categorical values, so it is randomly composed of values 1,3.4,5.6,13, which are the values given in the example in the GUI.
Here is an exemple of what it must look like:

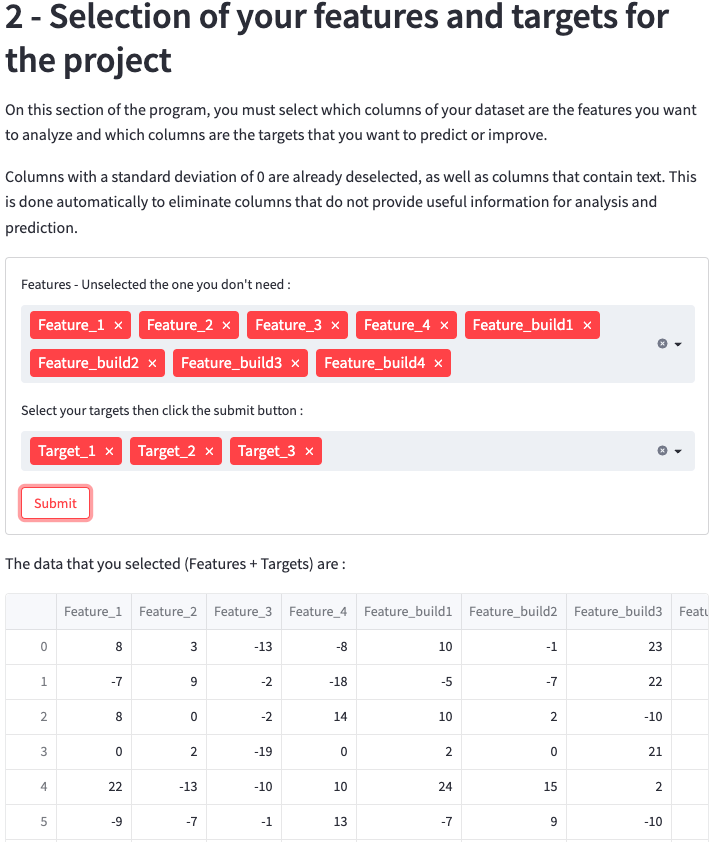
When your file is prepared, you can use MADGUI by uploading your file via the button in the sidebar:

After uploading your data you have to select what columns are features and which one are the target. Take note that the columns where the standard deviation is 0 are already take out from the selection because it doesn't help the prediction or optimisation.
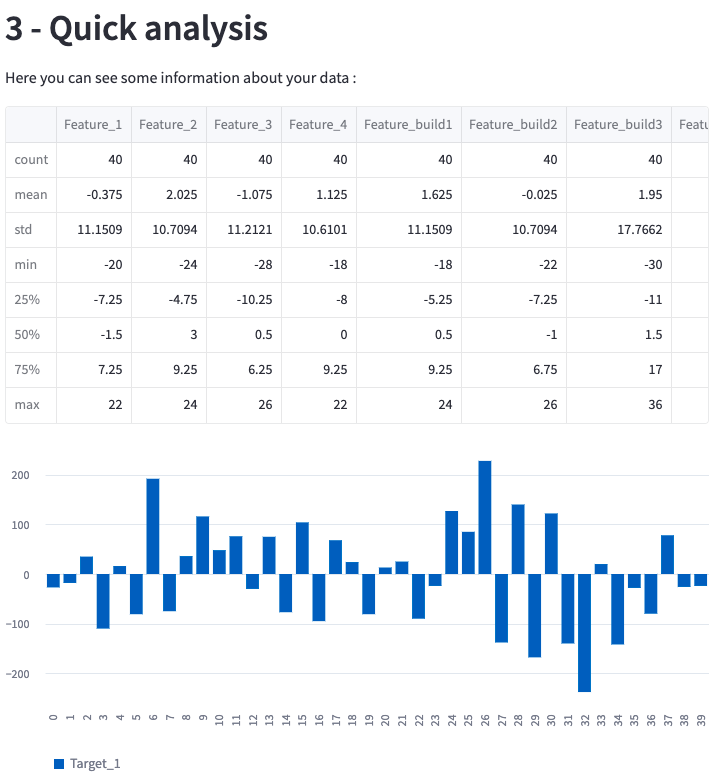
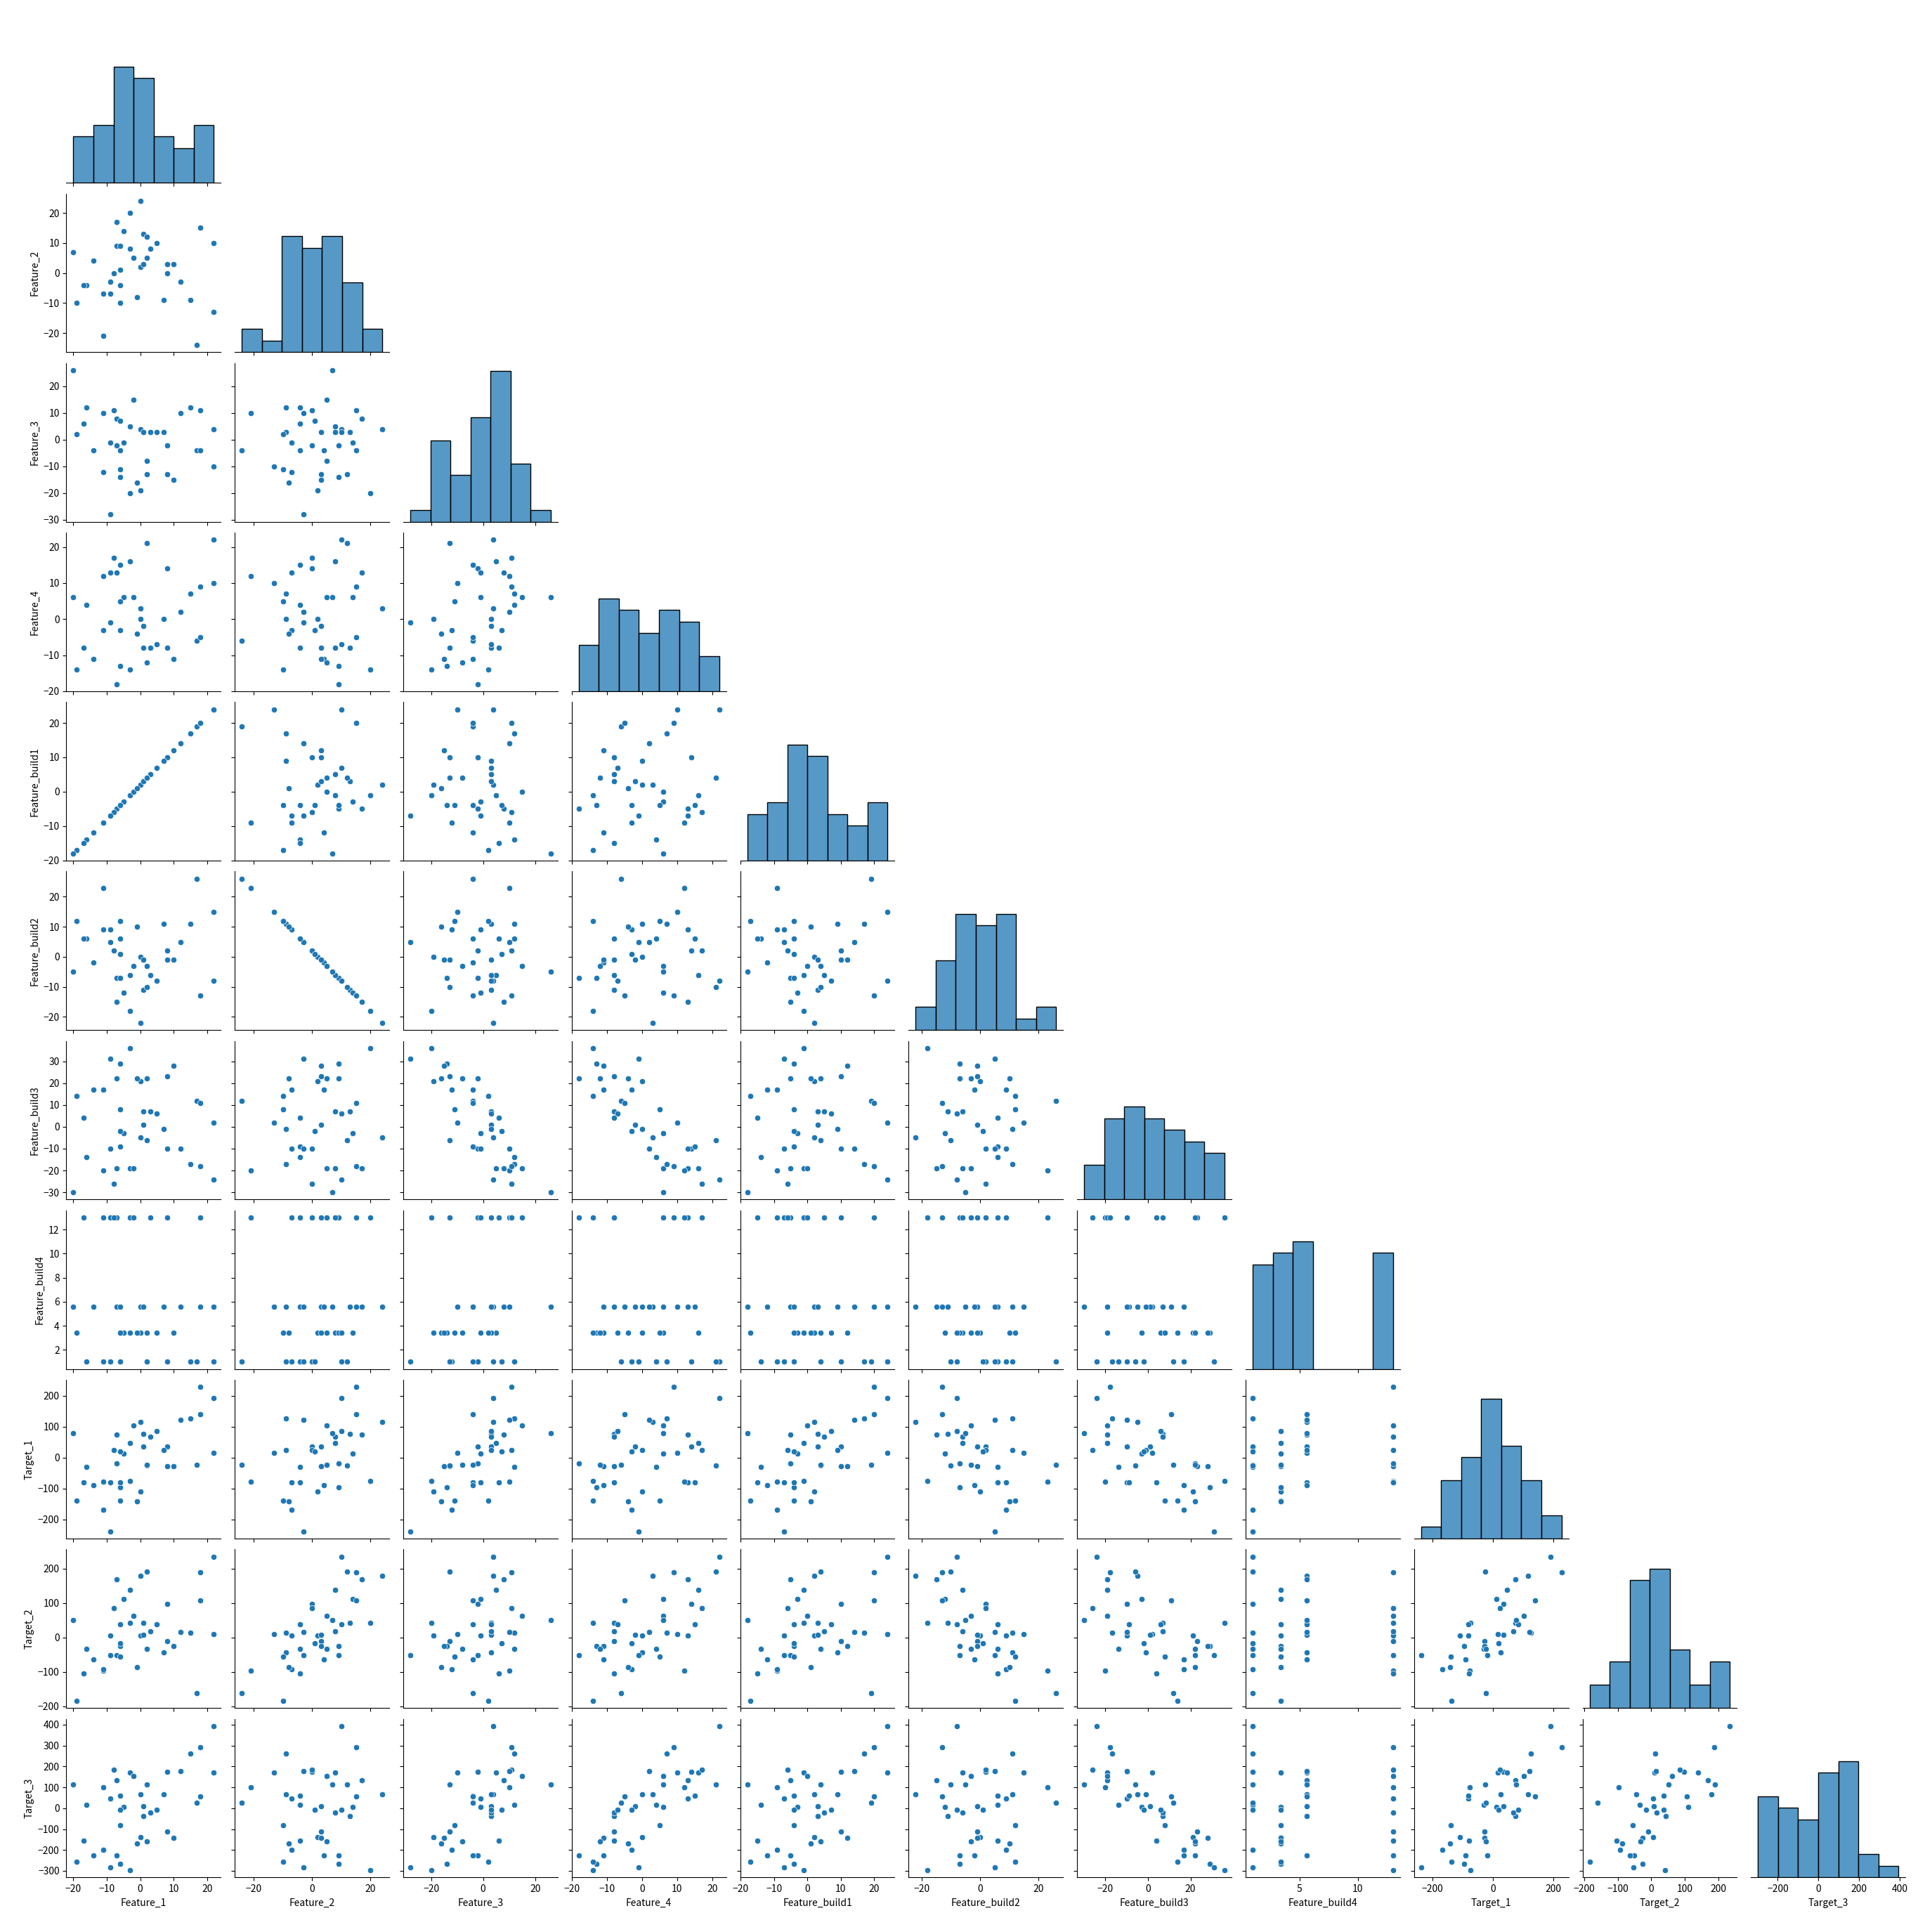
After your selection the GUI perform statistical analysis, first is a quick analysis of each columns (mean, min, max, std,...) and second is a correlation graph between each columns :
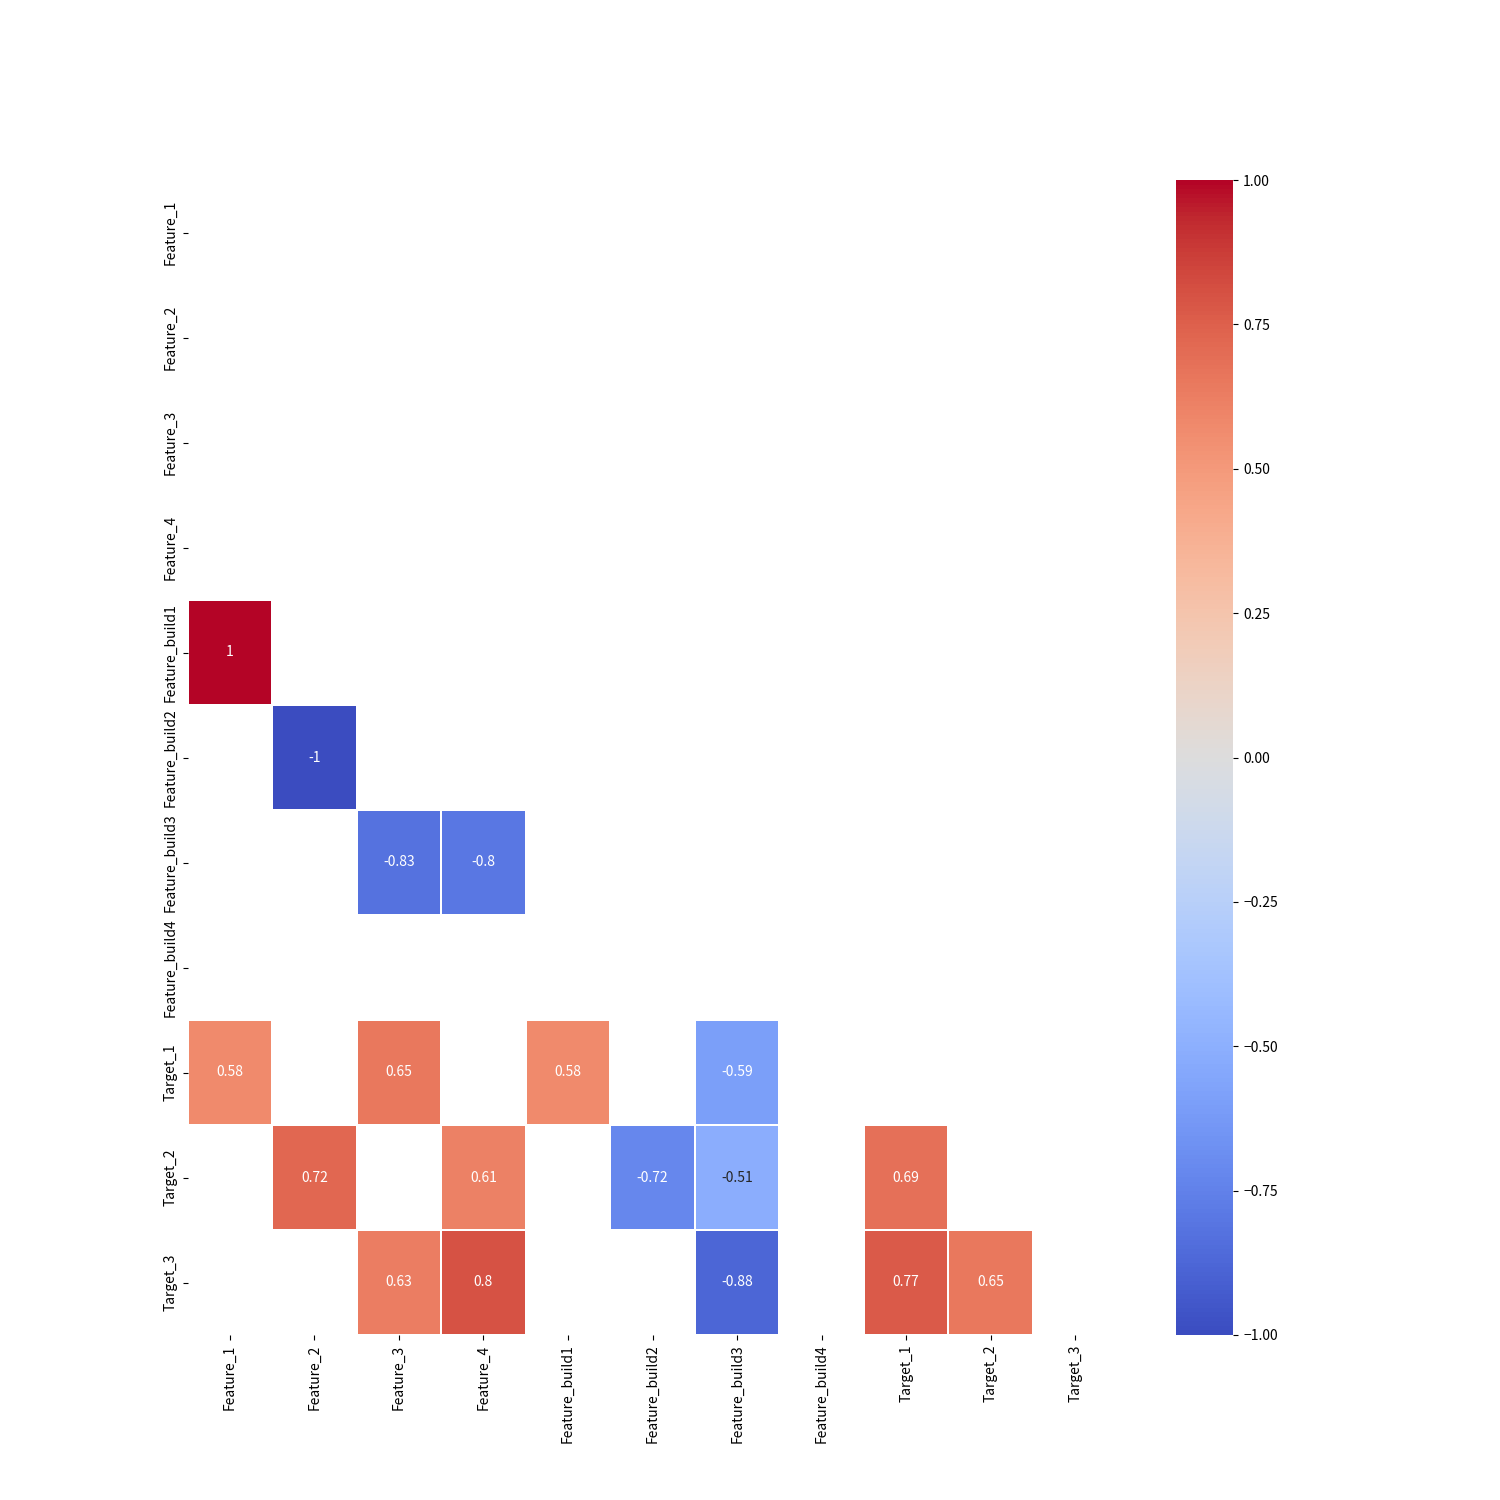
The GUI also allow users to analyse their datas with Pearson's correlation, the Pearson correlation measures the strength of the linear relationship between two variables:
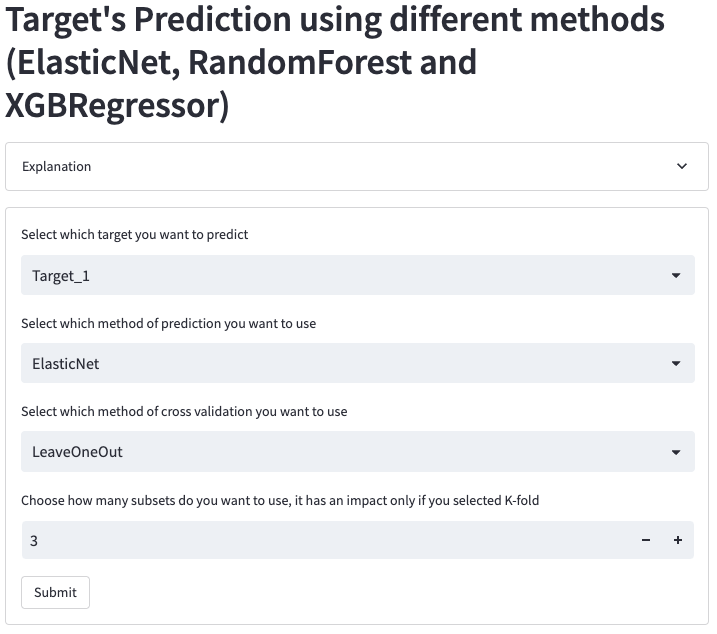
We utilize three machine learning methods: ElasticNet, RandomForestRegressor and XGBRegressor, with two kind of cross-validation: LeaveOneOut or K-fold for the prediction.

After the prediction, you can use the feature importance graph to see which features have the highest score for the prediction model. If the model is accurate, you can then reduce the number of features needed by using only those that have scored high.

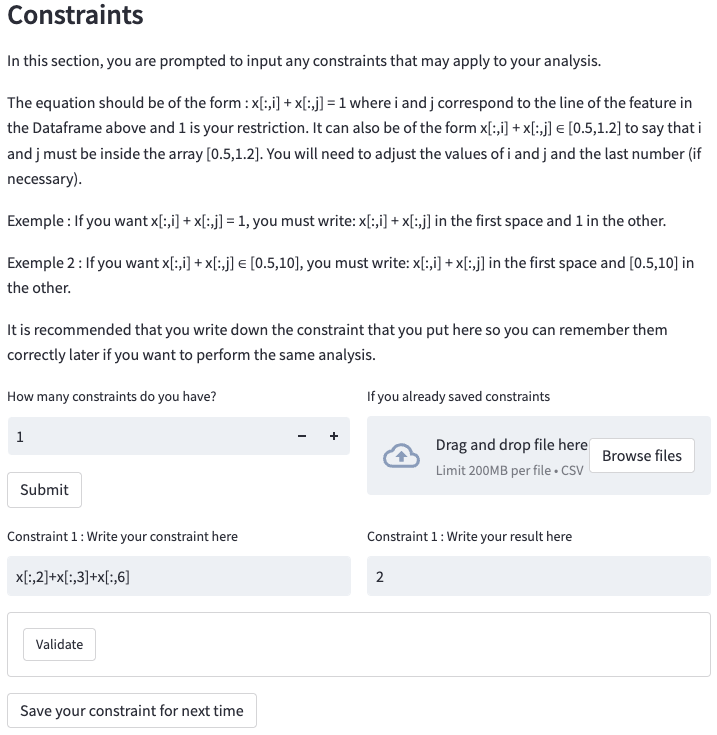
An strength of this GUI is the possibilities to define features's limitation and to apply constraints, the application take both of it in consideration for the optimization.

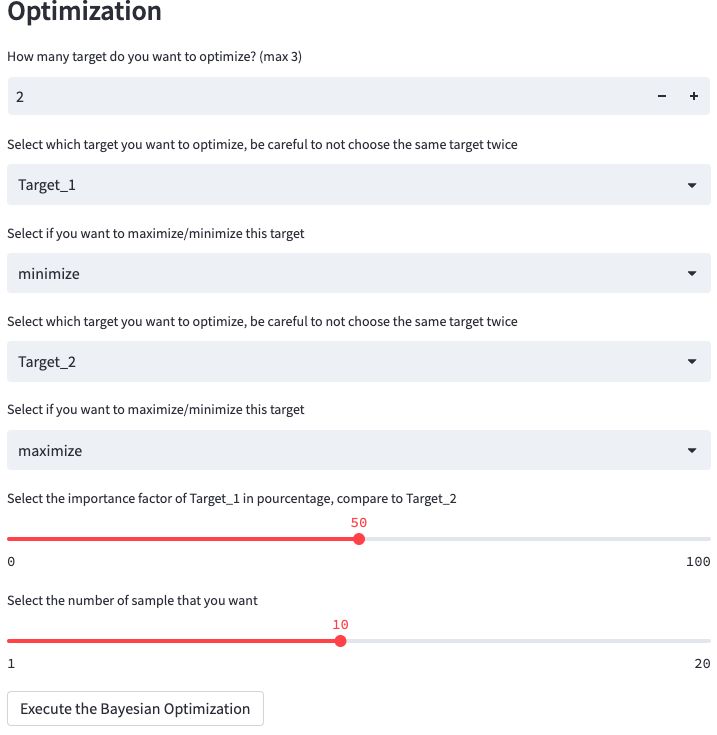
After all those limits and constraints you are ready to launch the optimisation. This GUI allow you to optimise one or several targets (up to 3), you can select for each one either to maximise or minimise it and also if you select multiple target you can determine the ratio between them (50-50 by default when two tagets are selected). The Acquisition function of this bayesian optimization is Expected Improvement, it is used to balance exploration and exploitation by quantifying the expected improvement of a candidate point over the current best observed value in the optimization process. It helps guide the search for the global optimum in an efficient manner.
The result of the optimisation will be display has a dataframe and is downloadable as a csv file.

The last part allow users to use prediction model and Bayesian Optimization at the same time to unbias the data for the initialisation of the Bayesian Optimization.

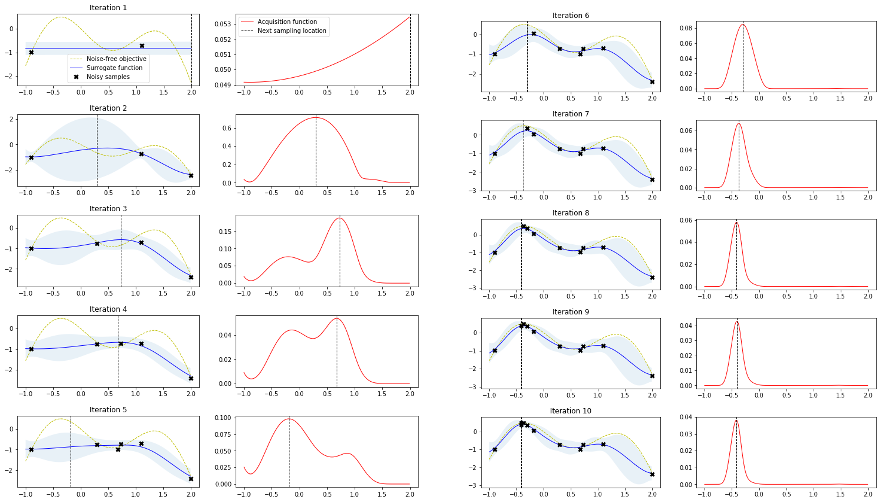
Here is an explanation of the Bayesian Optimization (source: http://krasserm.github.io/2018/03/21/bayesian-optimization/)
If you have difficulty to launch with the web version you can download the folder on GitHub to launch it in local version. It will run much faster. Go to the GitHub page ( https://github.com/Lambard-ML-Team/MADGUI ) then "Code" -> Download ZIP. Once it is down, you have to install all the requiered python's package needed by the GUI. To do that, just write: pip install -r requierements.txt
Then you are ready to go. Just use the cd command to go in the right folder for example if you put the folder in you Desktop just write:
cd Desktop/MADGUI -> To enter the folder
streamlit run MADGUI_local -> To launch the app