This is a beginner's (both to mass cytometry and R) attempt to recreate the plots like Cytobank.
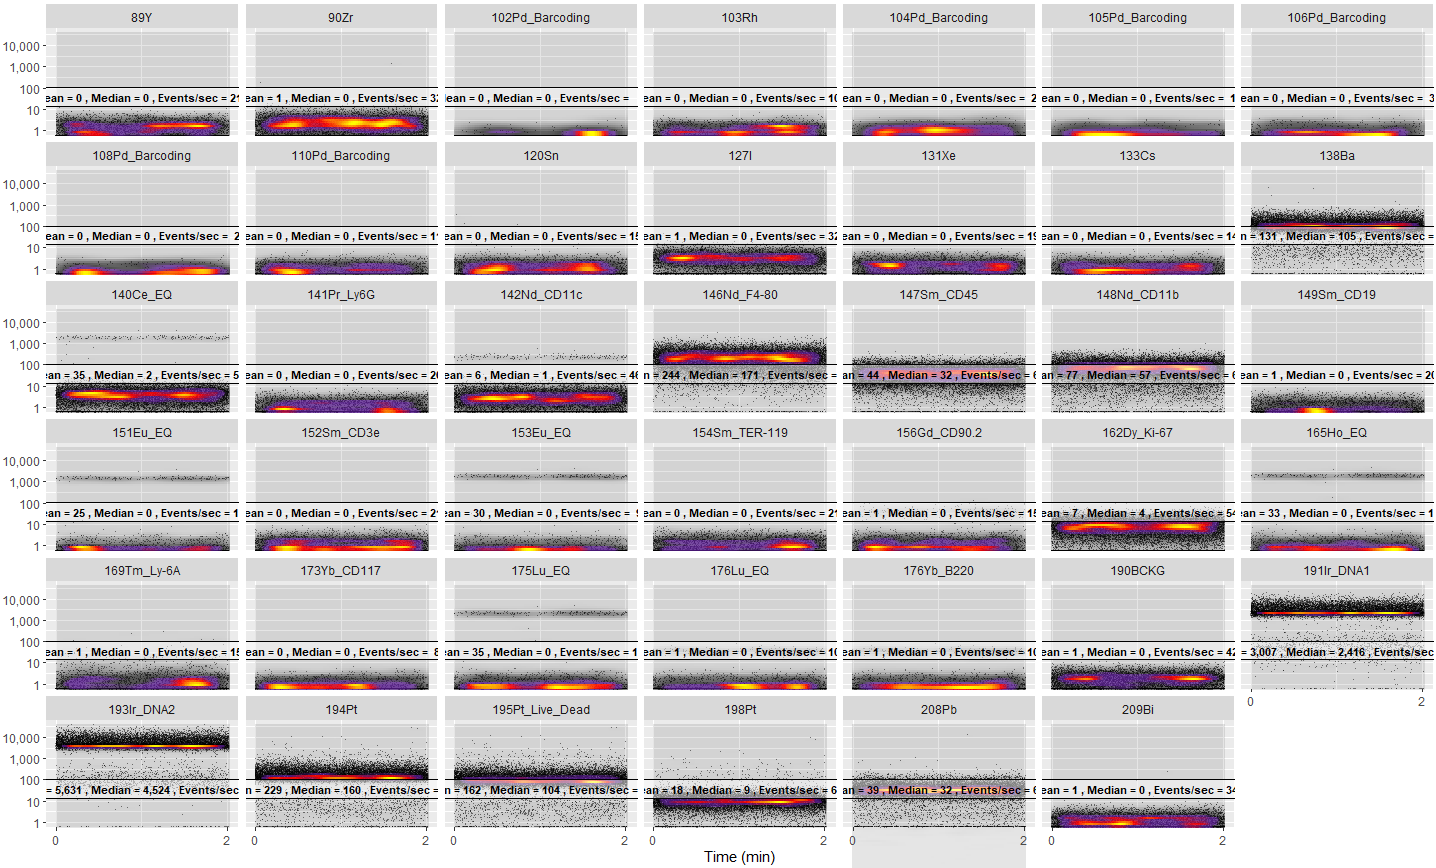
I wanted a simple way of getting an overview of every parameter. This could be from a CyTOF machine, like the Helios I'm using here, or a flow machine.
e.g.
Requirements:
In addition, you will need to install the relevant packages (FlowCore, reshape2, tidyverse, ggplot2, svdialogs) using the install.packages("packagename") command, which is not included in the script. UPDATED - Latest version includes all the code needed to check if the packages are present and install them if not.
This script will:
- Read in a specified FCS file opened with a dialogue window.
- Optionally transform the data using a data-specific logicle (you'll need to look at the code and remove the comments).
- Subsample down to 5,000 events if the dataset is large (or a user-specified number or proportion of events). Again, take a look at the code and modify it as needed.
- Ask the user which parameters to plot.
- Plot the chosen parameters using a similar graphically representation and palette as cytobank.
- If the file is from a CyTOF machine, give a summary of the number of cell events and the acquisition rate.
- Give the mean and median intensity and event/sec as an overlay on each plot.
Since the parameters can be numerous (e.g. I'm using a dataset with 62 parameters), it's best to use the "Zoom" function to view the output in fullscreen.
How I learned to do this:
I'm totally new to programming in R and very new to flow / mass cytometry.
The following links were incredibly useful for getting the code up and running:
- A very simple script to import some FCS data and plot it
- An incredibly complex CyTOF workflow with some snippets I could understand and implement
- A lot of this!
Improvements / things to do:
The graphical representation isn't perfect. I need to figure out a way of making the plots more "dense" and / or having the density overlay better defined.PARTIALLY FIXED in latest upload.The markers aren't getting imported for some reason (from Helios / CyTOF data). Only the parameter names are visible. They appear when plotted in e.g. FCS Express, so they must be in the FCS file?FIXED in latest upload.Uncertainty over the units of time and whether they differ between CyTOF and flow (BD) machines.UPDATE - Units of time are now correct for both flow and CyTOF. Tested with BD Aria and Helios.
Feedback / suggestions appreciated.
See also:
https://github.com/JimboMahoney/CytoBars