We are going to walk through the data wrangling process (Gathering - Assesment - Cleaning) on WeRateDogs twitter account, plus showcasing the efforts through analyses and visualizations using Python (and its libraries).
The tasks in this project are as follows:
- Data wrangling, which consists of:
- Gathering data
- Assessing data
- Cleaning data
- Storing, analyzing, and visualizing your wrangled data.
- Reporting on 1) your data wrangling efforts and 2) your data analyses and visualizations.
- You need to be able to work in a Jupyter Notebook on your computer.
- The following packages (libraries) need to be installed. You can install these packages via conda or pip:
- pandas
- NumPy
- requests
- tweepy
- json
-
The WeRateDogs Twitter archive contains basic tweet data for all 5000+ of their tweets as they stood on August 1, 2017, but not everything. One column the archive does contain though: each tweet's text, which have been used to extract rating, dog name, and dog "stage" (i.e. doggo, floofer, pupper, and puppo) to make this Twitter archive "enhanced." Of the 5000+ tweets, It have been filtered for tweets with ratings only (there are 2356). WeRateDogs is a Twitter account that rates people's dogs with a humorous comment about the dog. These ratings almost always have a denominator of 10. The numerators, though? Almost always greater than 10. 11/10, 12/10, 13/10, etc. You can find it here:
twitter_archive_enhanced.csv -
The tweet image predictions, i.e., what breed of dog (or other object, animal, etc.) is present in each tweet according to a neural network. Alongside each tweet ID, image URL, and the image number that corresponded to the most confident prediction (numbered 1 to 4 since tweets can have up to four images). This file (
image_predictions.tsv) is hosted on Udacity's servers and should be downloaded programmatically using the Requests library and the following URL: https://d17h27t6h515a5.cloudfront.net/topher/2017/August/599fd2ad_image-predictions/image-predictions.tsv
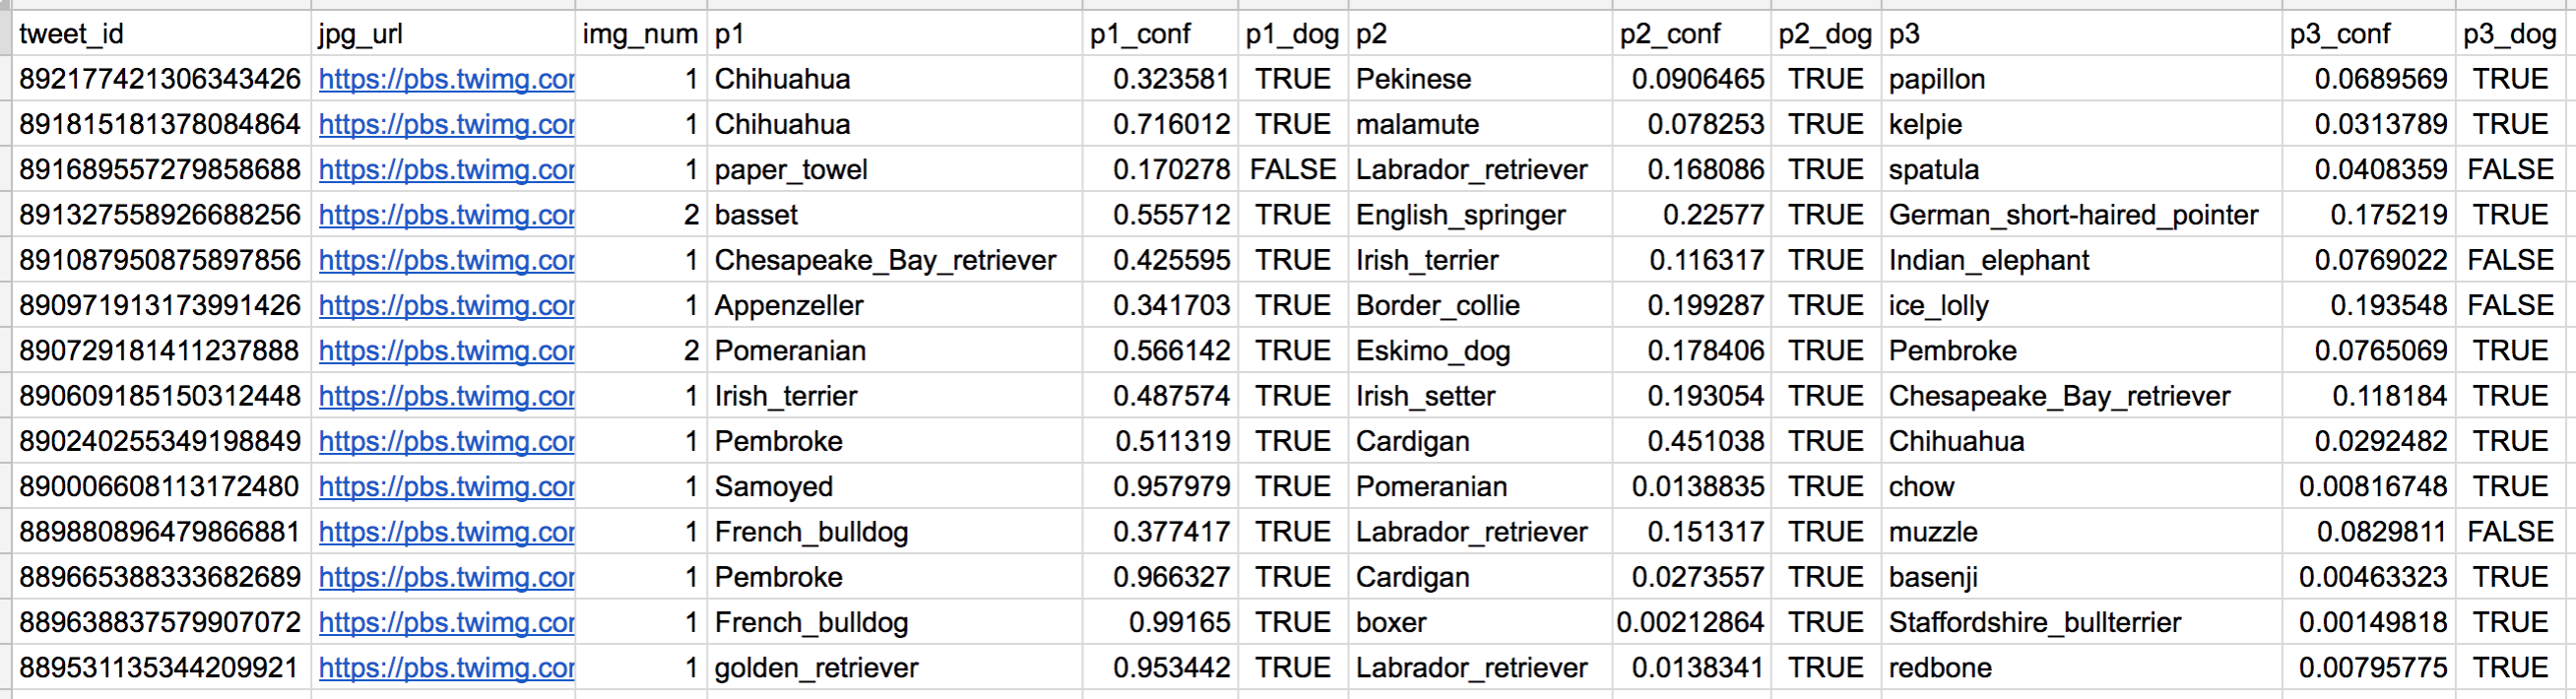
So for the last row in that table:
- tweet_id is the last part of the tweet URL after "status/" → https://twitter.com/dog_rates/status/889531135344209921
- p1 is the algorithm's #1 prediction for the image in the tweet → golden retriever
- p1_conf is how confident the algorithm is in its #1 prediction → 95%
- p1_dog is whether or not the #1 prediction is a breed of dog → TRUE
- p2 is the algorithm's second most likely prediction → Labrador retriever
- p2_conf is how confident the algorithm is in its #2 prediction → 1%
- p2_dog is whether or not the #2 prediction is a breed of dog → TRUE
- etc.
- Additional data via the twitter API: Each tweet's retweet count and favorite ("like") count at minimum, and any additional data you find interesting. Using the tweet IDs in the WeRateDogs Twitter archive, query the Twitter API for each tweet's JSON data using Python's Tweepy library and store each tweet's entire set of JSON data in a file called
tweet_json.txtfile. Each tweet's JSON data should be written to its own line. Then read this .txt file line by line into a pandas DataFrame with (at minimum) tweet ID, retweet count, and favorite count. Note: do not show your Twitter API keys, secrets, and tokens for public.
After gathering each of the above pieces of data, assess them visually and programmatically for quality and tidiness issues. Detect and document at least eight (8) quality issues and two (2) tidiness issues in your wrangle_act.ipynb Jupyter Notebook.
Clean each of the issues you documented while assessing. Perform this cleaning in wrangle_act.ipynb as well. The result should be a high quality and tidy master pandas DataFrame (or DataFrames, if appropriate).
Store the clean DataFrame(s) in a CSV file with the main one named twitter_archive_master.csv.
If additional files exist because multiple tables are required for tidiness, name these files appropriately.
Additionally, you may store the cleaned data in a SQLite database (which is to be submitted as well if you do).
Analyze and visualize your wrangled data in your wrangle_act.ipynb Jupyter Notebook. At least three (3) insights and one (1) visualization must be produced.
Create a 300-600 word written report called wrangle_report.pdf or wrangle_report.html that briefly describes your wrangling efforts. This is to be framed as an internal document.
Create a 250-word-minimum written report called act_report.pdf or act_report.html that communicates the insights and displays the visualization(s) produced from your wrangled data. This is to be framed as an external document, like a blog post or magazine article, for example.
Key points to keep in mind when data wrangling for this project:
- You only want original ratings (no retweets) that have images. Though there are 5000+ tweets in the dataset, not all are dog ratings and some are retweets.
- Cleaning includes merging individual pieces of data according to the rules of tidy data.
- The fact that the rating numerators are greater than the denominators does not need to be cleaned. This unique rating system is a big part of the popularity of WeRateDogs.
- You do not need to gather the tweets beyond August 1st, 2017. You can, but note that you won't be able to gather the image predictions for these tweets since you don't have access to the algorithm used.