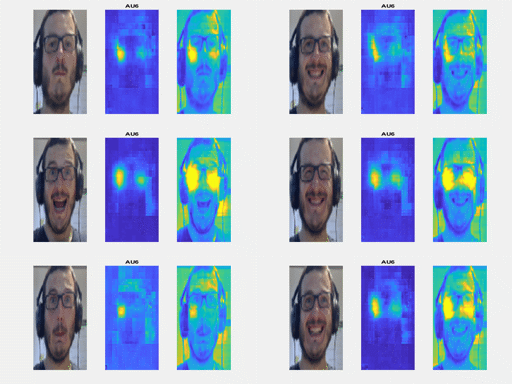
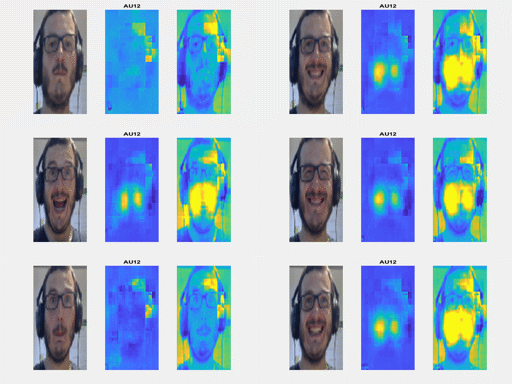
This is a built-in class for Action Unit intensity estimation with heatmap regression, adapted from the code used for the BMVC paper "Joint Action Unit localisation and intensity estimation through heatmap regression" (see citation below)
This class takes an image and returns the heatmaps and the AU predictions from them. In order to create a standalone class the points are detected using the dlib facial landmark detector. This will be shortly replaced by the iCCR tracker, whose Python implementation is underway (you can check the Matlab code here).
An example of usage is included in the first release. Full scripts for folder and csv reading will follow soon.
The Hourglass model has been kindly adapted from the FAN network. You can check Adrian's amazing code here
dlib --> pip install dlib Link
OpenCV --> pip install cv2 Link
PyTorch --> follow the steps in https://pytorch.org/
It also requires scipy and matplotlib, and the Python version to be 3.X
pip install dlib
pip install cv2
To use the code you need to download the dlib facial landmark detector from here and add it to your folder.
This all you need to run the detector (the visualisation in this script is really poor, I will work on improving it)
import AUmaps
import glob
import dlib
import matplotlib.pyplot as plt
AUdetector = AUmaps.AUdetector('shape_predictor_68_face_landmarks.dat',enable_cuda=False)
path_imgs = 'example_video'
files = sorted(glob.glob(path_imgs + '/*.png'))
fig = plt.figure(figsize=plt.figaspect(.5))
for names in files:
    print(names)
    img = dlib.load_rgb_image(names)
    pred,map,img = AUdetector.detectAU(img)
    for j in range(0,5):
        resized_map = dlib.resize_image(map[j,:,:].cpu().data.numpy(),rows=256,cols=256)
        ax = fig.add_subplot(5,2,2*j+1)
        ax.imshow(img)
        ax.axis('off')
        ax = fig.add_subplot(5, 2, 2*j+2)
        ax.imshow(resized_map)
        ax.axis('off')
    plt.pause(.1)
plt.draw()All contributions are welcome
@inproceedings{sanchez2018bmvc,
  title = {Joint Action Unit localisation and intensity estimation through heatmap regression},
  author = {Enrique Sánchez-Lozano and Georgios Tzimiropoulos and Michel Valstar},
  booktitle = {BMVC},
  year = 2018
}

