Alex Young - alexdy2007
Lukas Weiss - blanche
Utku Ozbulak - utkuozbulak
We wanted to come up with a forward indicatior that Bloomberg doesn not offer right now but might help their business and product range.
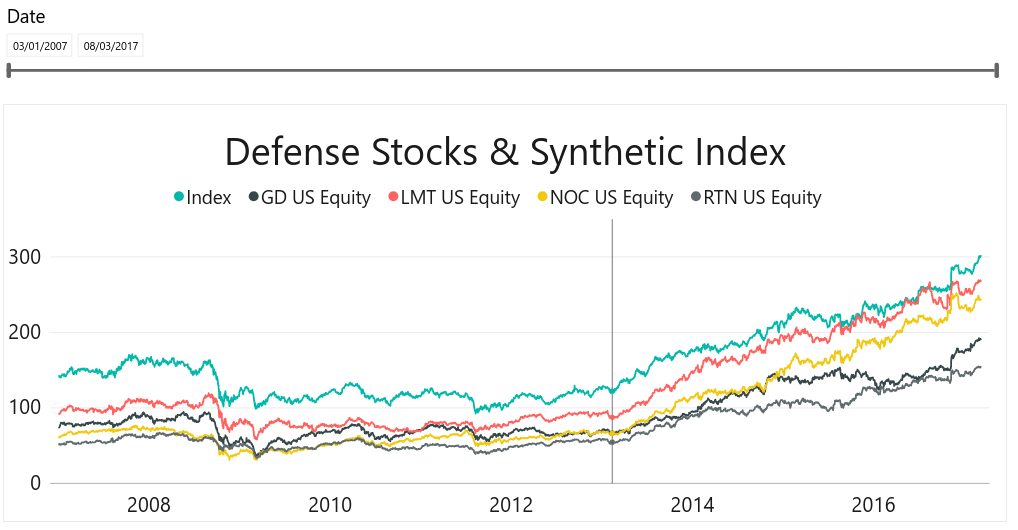
We created an index out of defense firms that specialized in the sale of armanents and munitions and did not have exposure to other markets. Below is the visualisation of few of those companies' stocks, it was obvious that those companies are correlating and if we were to create a synthetic index out of their average it would reflect the trend of those stocks.
We analyzed different window sizes to feed to our machine learning algorithms to predict the momentum of the index and finally decided to use window size of 30. Each input is a day shifted version of the previous one. The target(Y) here is the average of the synthetic index of next 30 days after the last input, the motive behind that was to predict, on average, what will happen to those stocks in the future.
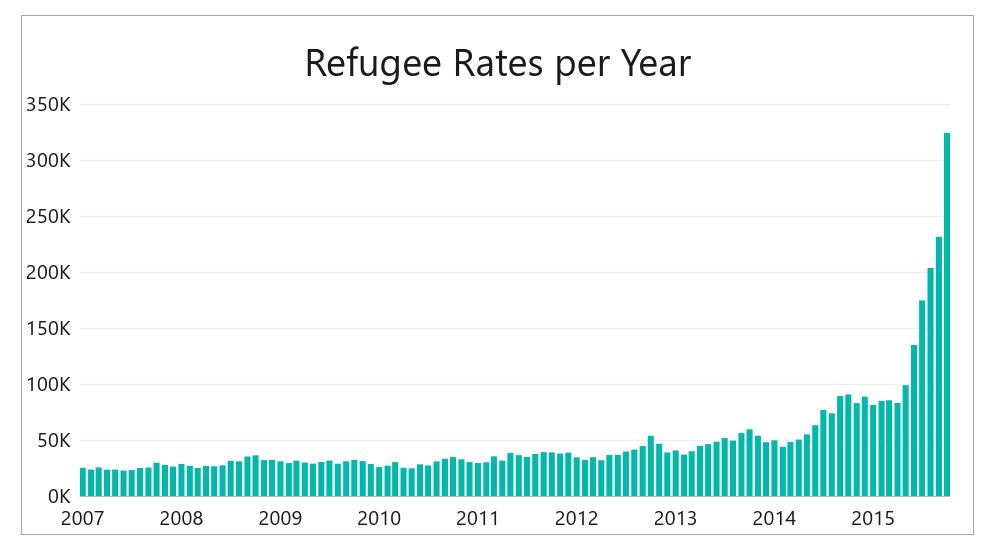
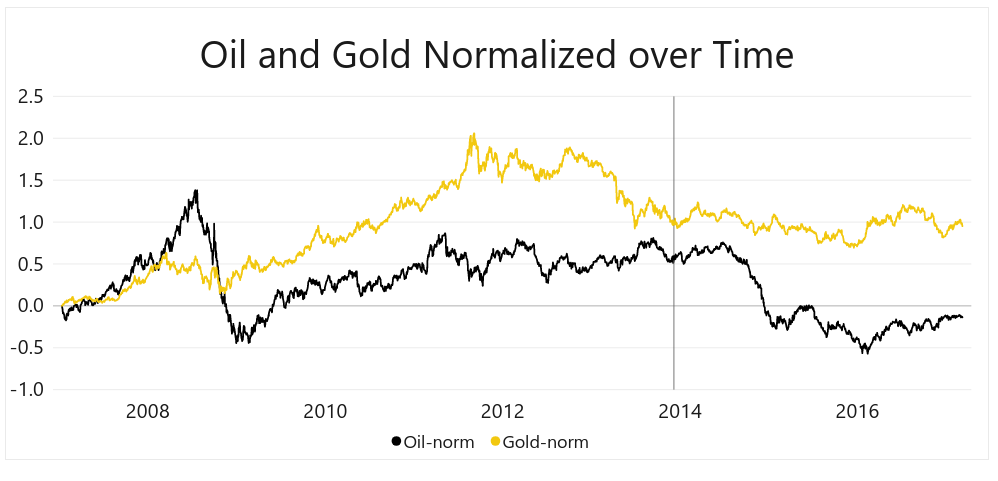
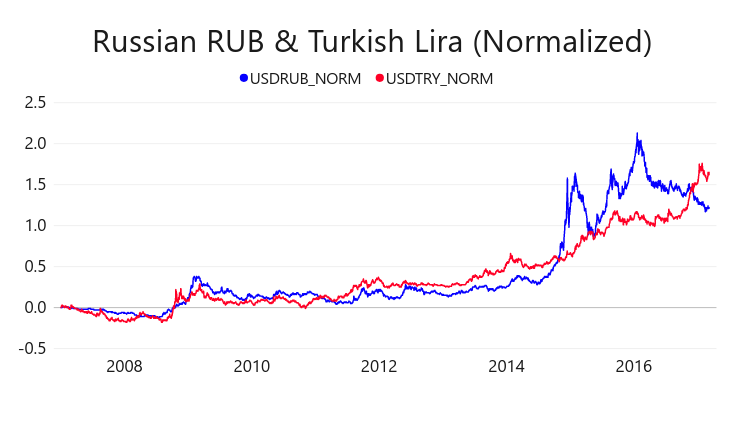
In order to capture global political instability, we also used some external datasets such as global refugees per month, oil and gold prices as well as currencies that might be majorly affected from current turmoil.
We modeled our data as 30 days window size of the index (average of sum of all defense industry stocks) then we added gold price as an average of past 20 days to smooth out any spikes and global refugee count of that month.
Out of many models we worked on, we found out that from these external features, only the change in gold prices and total refugee count helped us increase the prediction accuracy of the synthetic index.
Of all available regression algorithms that are available in Azure Machine Learning Studio, our Linear Regression with 0.005 regularisation rating gave the best result with ~3% absolute error.
Unfortunately, many models we tried on Neural Nets did not converge to the solution which might be an indicator that we need more data.
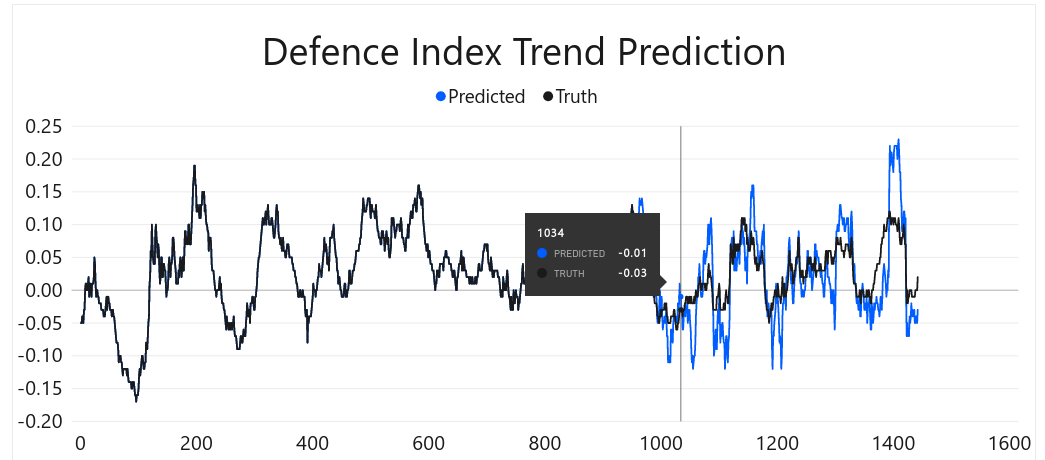
Below, is the test result of 3 months, overall, we were able to capture trends but we overshoot the trends from time to time. The change(Y Axis) is the predicted percentage increase or decrease on defense industry(stocks) of next 15 days and the X axis is time represented in days.
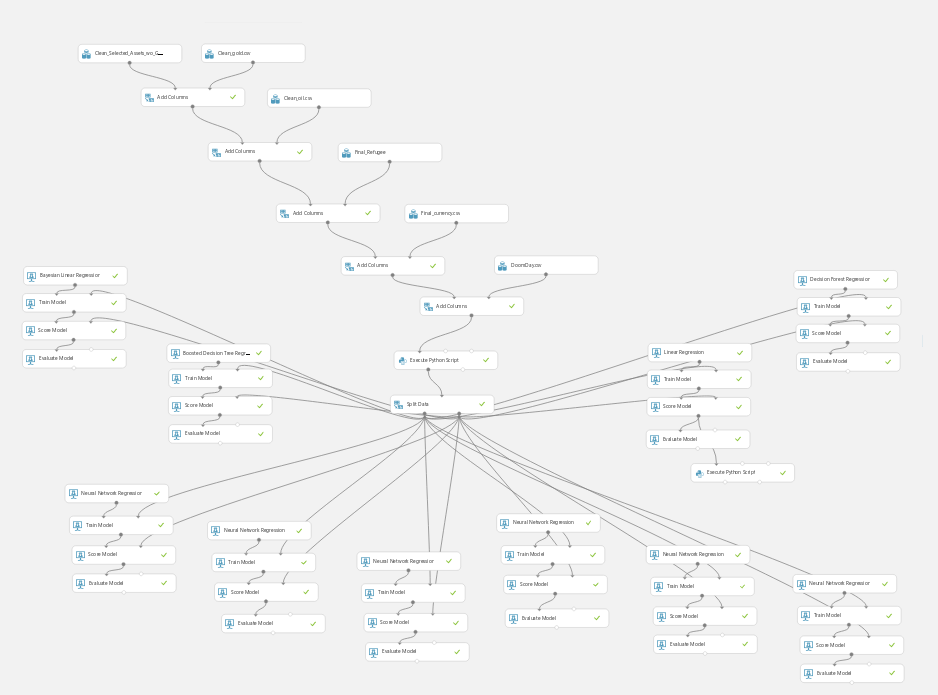
The final model we used in Azure Studio is like below, at bottom we have 6 different Neural Nets which we tried to tune heavily but didn't succeed, and on sides, other regression algorithms.
After tuning each algorithm, the best results of individual ML algorithms are below:
We then visualised the data we used and the prediction with Microsoft Power BI. Images above are exports of those visualisation.
-
Azure-ML folder contains the images of model and the datasets.
-
Final_Datasets folder contains all the data we ended up using in our latest model with Train-Test-Full.csv having the final test data with window sizes and all additional features.
-
PowerBI_Image_Exports Contains all the images from PowerBI that we used to express the results and our reasoning.
-
Python_src contains the python code that we used in AzureML Studio and ipynb.
