In April 2020 the BBC Shared Data Unit reported on significant drops in air pollution in the two weeks since the country went into lockdown to stop the spread of coronavirus.
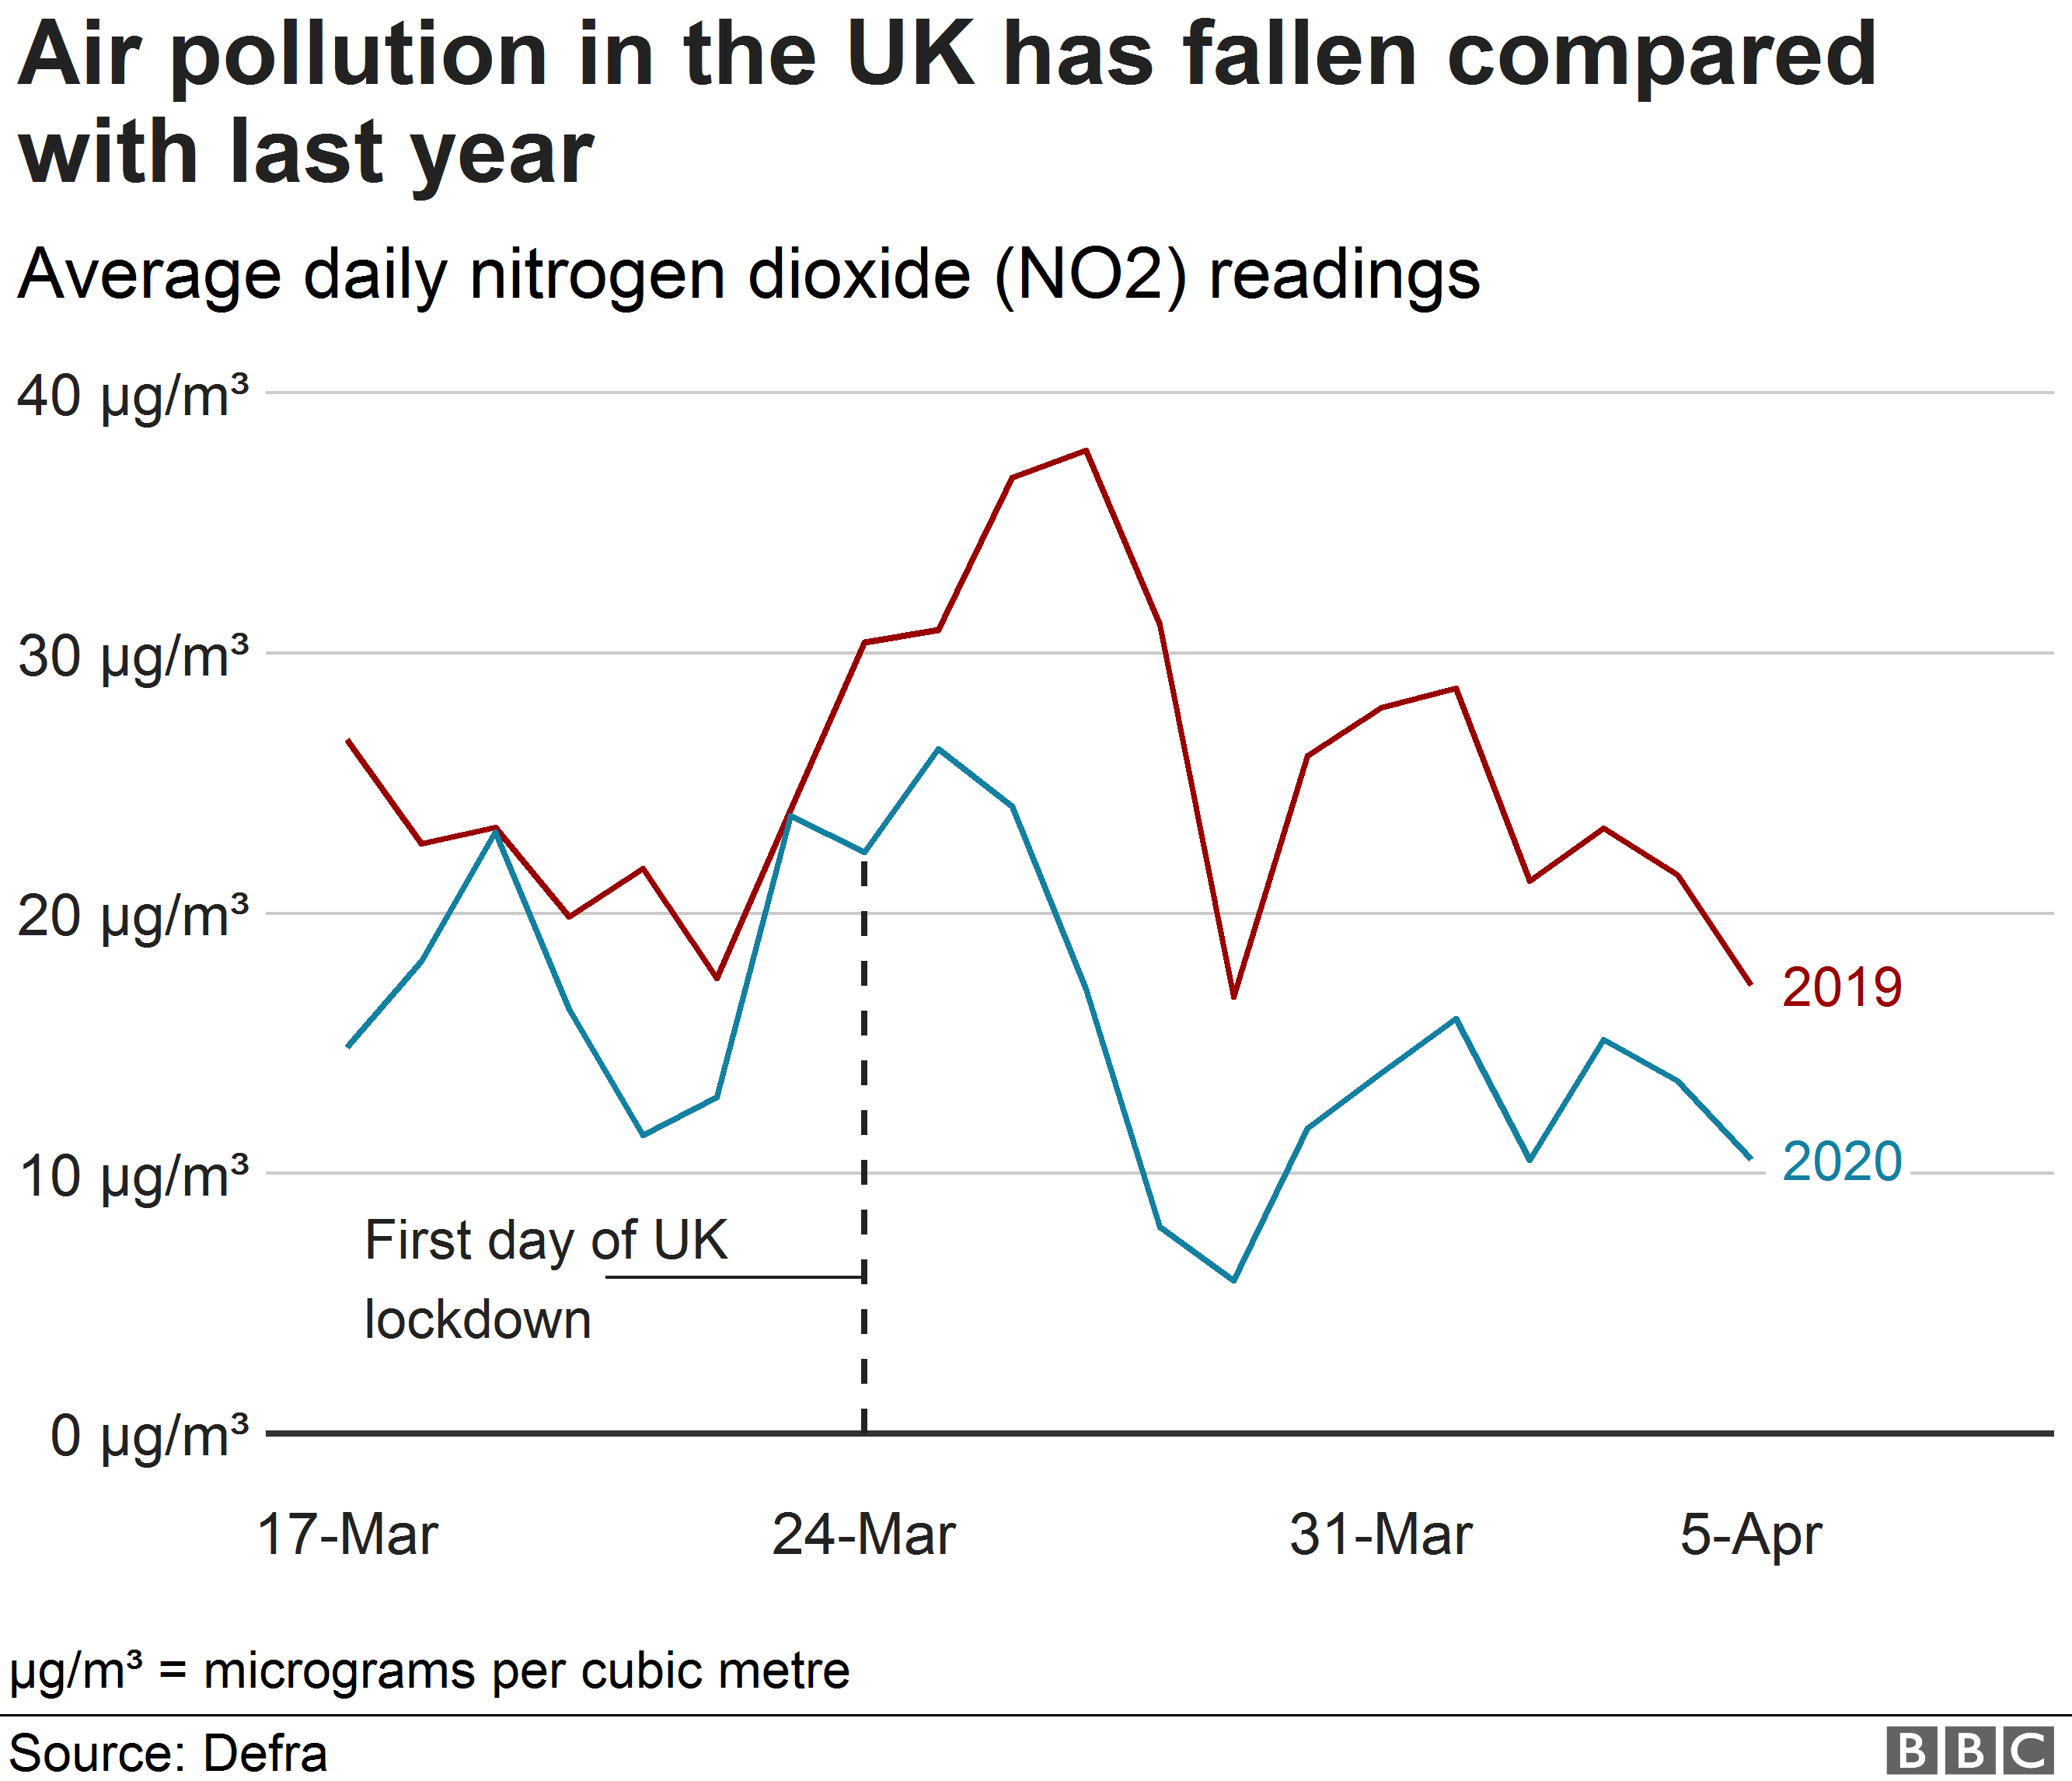
Daily readings from air quality monitoring stations since the lockdown was announced on 23 March were compared to the same period last year, accounting for weekdays.
The Shared Data Unit makes data journalism available to news organisations across the media industry, as part of a partnership between the BBC and the News Media Association. Stories generated by the partnership included:
- Radio Exe: Exeter air pollution plummets 9 April 2020
- Oldham Evening Chronicle: Significant fall in Oldham's pollution levels since lockdown 9 April 2020
- Birmingham Live: 8 positive things Birmingham can learn at home during self-isolation 12 April 2020
- The Lincolnite: Lincoln air pollution halves in first two weeks of lockdown 16 April 2020
- Plymouth Live: Plymouth's air quality has improved during the coronavirus lockdown 21 April 2020
- Manchester Evening News: Air pollution levels have fallen by more than a third in Manchester since the coronavirus pandemic lockdown, a study reveals 23 April 2020
- Nottinghamshire Live: Air pollution in Nottingham drops to lowest level on record during lockdown 24 April 2020
- Edinburgh Live: Timeline: How the new coronavirus spread in Edinburgh and the Lothians 26 April 2020
- Leeds Live: The simply staggering impact lockdown has had on air pollution in Leeds 27 April 2020
- Cheshire Live: Coronavirus lockdown brings huge fall in air pollution in Warrington 1 May 2020
The story was also used by BBC Tees, BBC Somerset, BBC Hereford & Worcester, BBC Radio Lincolnshire, BBC Radio Derby and BBC Radio Devon
- Defra: Latest measured levels based on data provided by the Environment Agency
- XLSX: Air pollution data including regional analysis
- Jenny Bates, clean air campaigner, Friends of the Earth
- William Bloss, professor of atmospheric science, University of Birmingham
- Simon Curry, ecologist and councillor, Medway Council
- Spokesperson, Defra
- Multiple line chart: Average daily nitrogen dioxide readings, March 17-April 5 2019 vs 2020
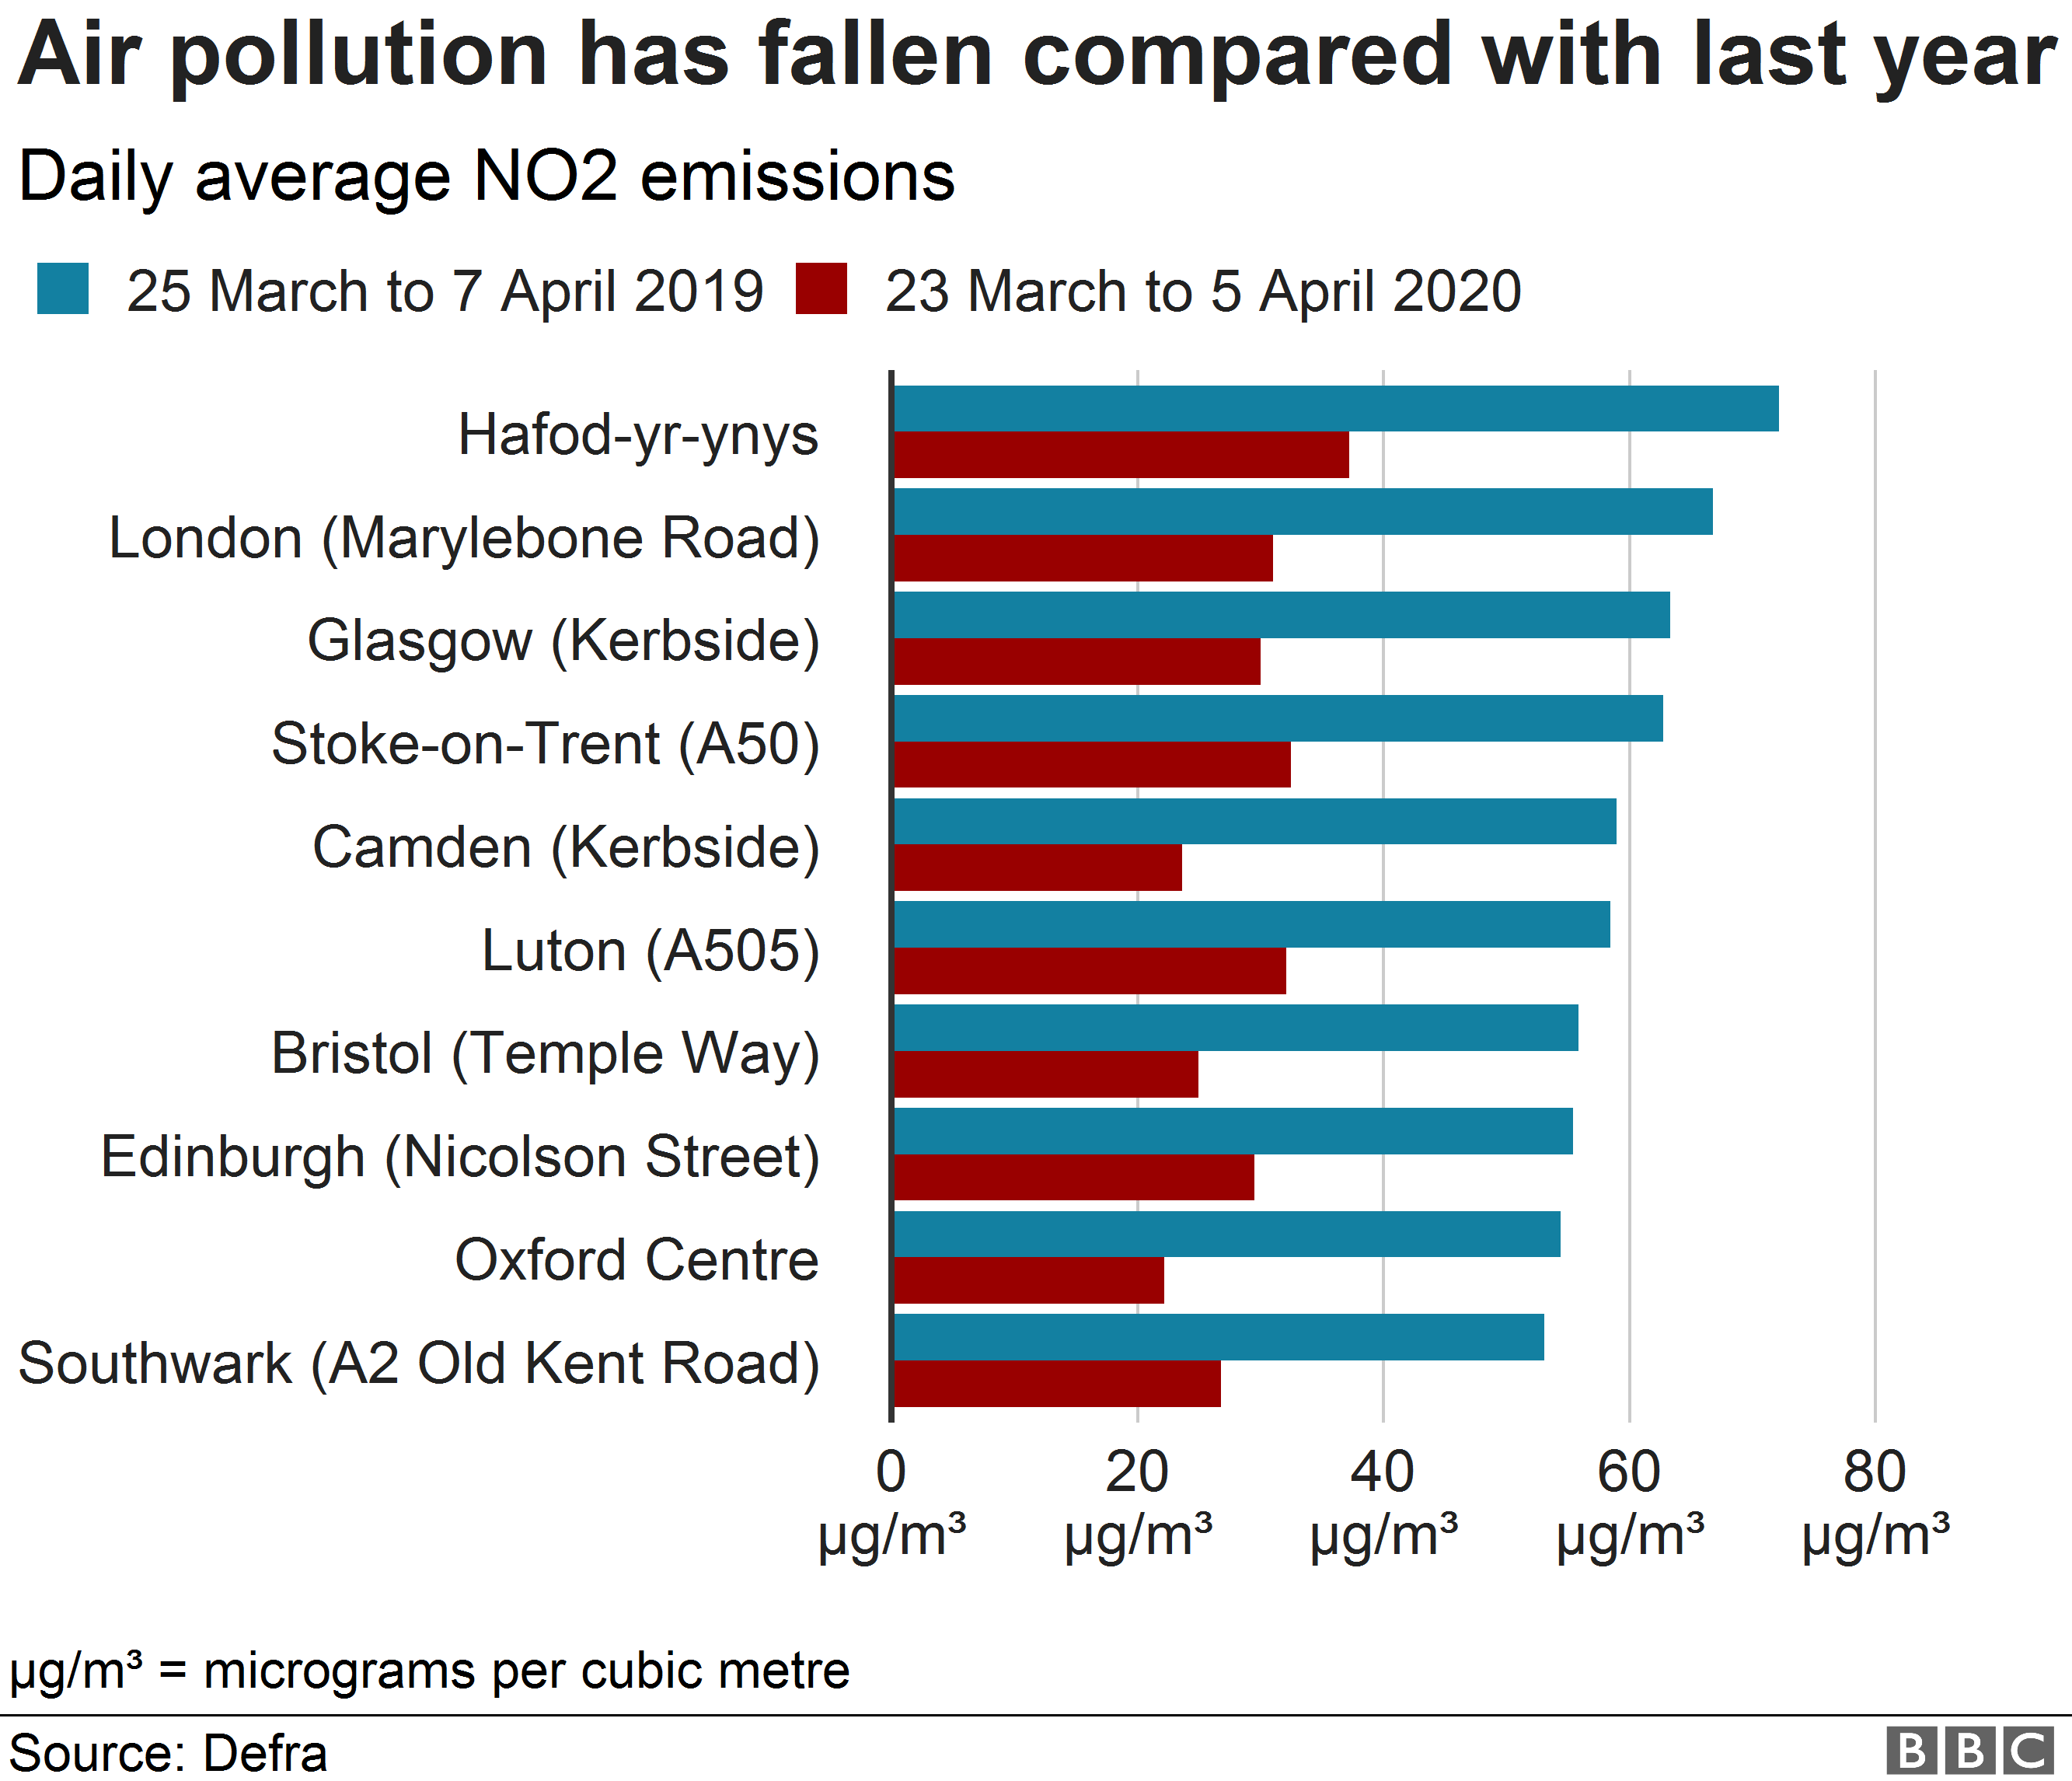
- Grouped bar chart: Daily nitrogen dioxide readings by most polluted areas, March 17-April 5 2019 vs 2020
- R script: data analysis
You can find all coronavirus-related stories by the BBC data units tagged 'coronavirus' here