This dataset was provided by the professor. This dataset is having 14 variables with 1499 observations. These two variables are in integer format and others are in string format.
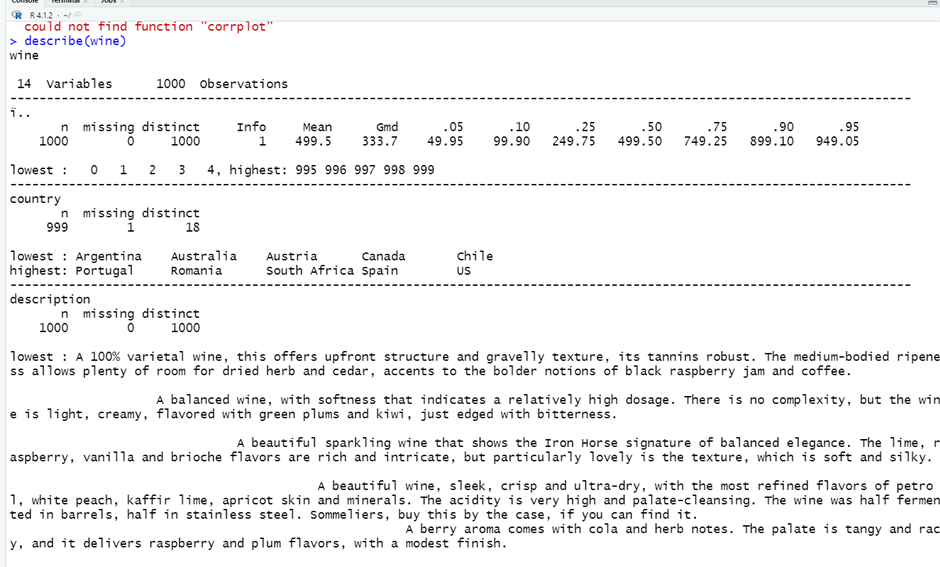
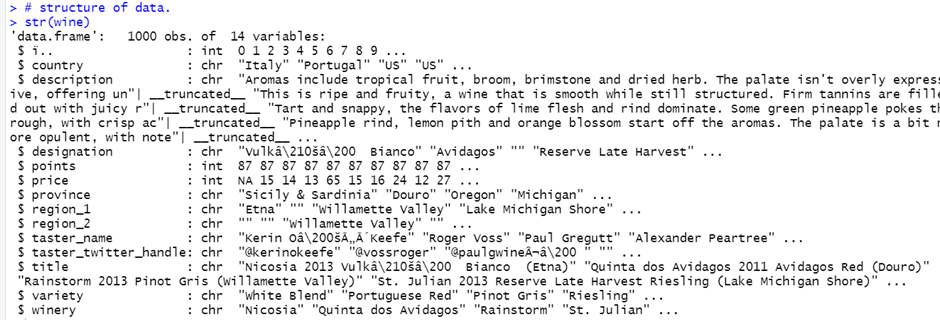 2. Then I used describe func., as it shows mean, median, mode, S.D and missing values, highest, lowest and missing distinct values.
3.
2. Then I used describe func., as it shows mean, median, mode, S.D and missing values, highest, lowest and missing distinct values.
3.  3. I tried to remove duplicate values in this plot but there no such duplicate value is present.
4. I use a subset in countries columns to remove one row, using this!= "condition that row removed. As it’s replaced all the unwanted values to spaces and removed one row of countries column as there was no name has been mentioned so I dropped that row.
3. I tried to remove duplicate values in this plot but there no such duplicate value is present.
4. I use a subset in countries columns to remove one row, using this!= "condition that row removed. As it’s replaced all the unwanted values to spaces and removed one row of countries column as there was no name has been mentioned so I dropped that row.
 I created a country variable and created the sum of all the countries, so I’ll get to know which country has the maximum and minimum frequency.
7. I created histograms of points and price.
8.
I created a country variable and created the sum of all the countries, so I’ll get to know which country has the maximum and minimum frequency.
7. I created histograms of points and price.
8. 
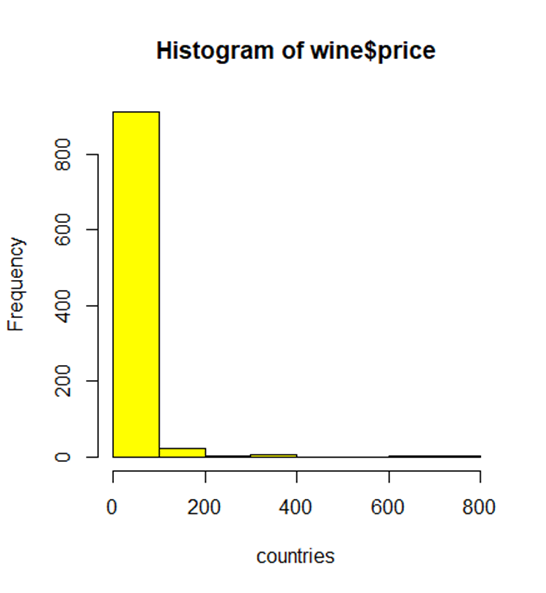 In points histogram, it’s showing right-skewed distribution with normal distribution and price histogram are extremely right-skewed as it increases and suddenly decreases at the peak point.
8. I created a scatter point to see what the difference between points and price was and then created a regression line for the clear vision.
In points histogram, it’s showing right-skewed distribution with normal distribution and price histogram are extremely right-skewed as it increases and suddenly decreases at the peak point.
8. I created a scatter point to see what the difference between points and price was and then created a regression line for the clear vision.
 It shows that there are a lot of outliers were presented in this graph. That outlier plays an important role so we can’t ignore that outlier.
SD are in between 90.
9. This chart shows, how many wines are present and how many times they gets tested.
10.
It shows that there are a lot of outliers were presented in this graph. That outlier plays an important role so we can’t ignore that outlier.
SD are in between 90.
9. This chart shows, how many wines are present and how many times they gets tested.
10.  10. Replaced all NA values dataset to zero(0).
11. Replaced all the blank values to “Unknown” words in the regional sector.
12. using group by I created a new variable called, "vapes" and I summarise with price and points as its numerical values.
10. Replaced all NA values dataset to zero(0).
11. Replaced all the blank values to “Unknown” words in the regional sector.
12. using group by I created a new variable called, "vapes" and I summarise with price and points as its numerical values.


 This bar chart shows what was wine prices in different countries.
In the next plot, I also created a boxplot.
14. I created mean and median for countries using new variables.This graph shows, I create a mean point variable and using the mean points it’s’ showing the graph.
15.
This bar chart shows what was wine prices in different countries.
In the next plot, I also created a boxplot.
14. I created mean and median for countries using new variables.This graph shows, I create a mean point variable and using the mean points it’s’ showing the graph.
15. 

