A rust implementation of regioneR for interval overlap permutation testing.
Binaries are available under releases.
Or, build from the repo:
git clone https://github.com/ACEnglish/regioners
cd regioners
cargo build --release
# build with progress bars by adding `--features progbars`
# executable in ./target/release/regionersCheck for the significance of CpG islands' intersection with promoters
# Download test beds
bash test_beds/track_getter.sh
# Test
./target/release/regioners -g test_beds/grch38.genome.txt \
		           -A test_beds/grch38.epd_promoters.bed \
			   -B test_beds/grch38.cpg_islands.bed \
			   -o cpgiVprom.json
# Look at all options available
./target/release/regioners -hregioners performs a permutation test on the intersection of two bed files. It first counts the number of intersections
between the two bed files and then will randomly shuffle one of the bed files and count the number of intersections.
This shuffling/counting is repeated --num-times. The mean and standard deviation of the permutations is compared to the
original intersection and a p-value is computed.
There are a number of options for controlling how regioners runs. Most have to do with IO and four are important for
the tests.
How intervals are randomized is an important part of the permutation test. By default, regioners will randomly
shuffle each region. For example, two regions at (x1, y1), (x2, y2) will each get a random shift (r) to
(x1±r1, y1±r1) and (x2±r2, y2±r2).
With circle, all regions are shifted by a set amount such that their spatial distances are preserved. i.e.
(x1±r1, y1±r1), (x2±r1, y2±r1)
The novl method is much like the shuffle method, except that regions won't overlap after shuffling. This is achieved
by looking at all uncovered spans of the genome and randomly breaking them apart into smaller segments. novl
then shuffles all regions with the uncovered segments. This shuffled list is then re-placed along the genome,
discarding the uncovered segments and updating the regions to their new position. Note that this strategy is slightly
less random. See src/gapbreaks.rs for details.
Some intervals shouldn't be shuffled across chromosomes. For example, genes are not randomly
distributed across chromosomes (ref).
Therefore, the randomization strategy may need to limit where intervals are moved.
The --per-chrom flag will keep intervals on their same chromosome.
By default, all calculates intersections as the number of overlaps. For example, if one -A region hits two -B regions,
that counts as two intersections. With any, the presence of an intersection is counted. So our example above would count
a single intersection.
The genome may have regions where intervals should not be placed (e.g. reference gaps). Input intervals overlapping masked regions are removed and randomization will not place intervals there.
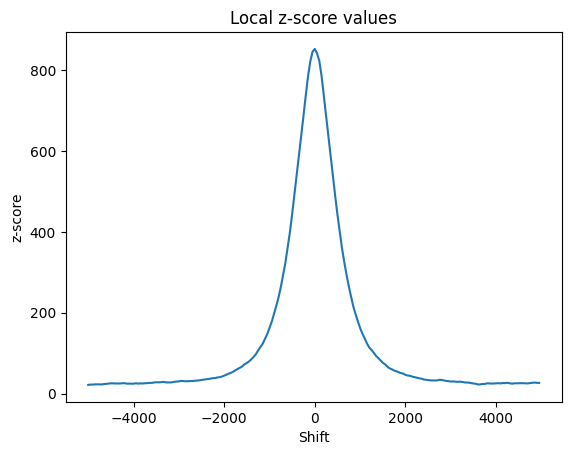
regioners will calculate a local z-score for the two intervals' overlap
(details).
The --window is how many basepairs upstream and downstream the intervals will be shifted to perform the local z-score and the
--step is the step size of the windows. For example, with a 1,000bp --window and --step of 100bp, the output will
have 20 local z-scores.
--genome: A two column file withchrom\tsize. This becomes the space over which we can shuffle regions. If there are any regions in the bed files on chromosomes not inside the--genomefile, those regions will not be loaded.-Aand-B: Bed files with genomic regions to test. They must be sorted and everystart < stop.--num-times: Number of permutations to perform. See this for help on selecting a value.--no-merge-ovl: Turn off merging of overlapping intervals in-Aand-Bbefore processing. Incompatible with--random novl.--no-swap: Turn off swapping-Aand-Bif-Acontains fewer intervals.
Test of 1,000 permutations on 29,598 promoter regions tested against 1,784,804 TRs using 4 cores on a Mac book. For comparison, a regioneR test of 100 permutations on above data in an Rstudio docker: 1292.313s
- --random shuffle: 3.4s
- --random shuffle --per-chrom : 3.2s
- --random circle : 2.8s
- --random circle --per-chrom : 2.8s
- --random novl : 11.0s
- --random novl --per-chrom : 6.4s
The output is a json with structure:
- A_cnt : number of entries in
-A(note may be swapped from original paramter) - B_cnt : number of entries in
-B(note may be swapped from original paramter) - count : overlap counter used
- no_merge : input beds overlaps were not merged before processing if true
- per_chrom : randomization performed per-chromosome
- random : randomizer used
- swapped : were
-Aand-Bswapped - test : dictionary of test results
- localZ : dictionary of local z-score results
Test Key/Values
- alt : alternate hypothesis used for p-value - 'l'ess or 'g'reater
- mean : average number of overlaps of the permutations
- num_perms : number of permutations performed
- observed : observed number of intersections
- pval : permutation test's p-value
- perms : list of permutations' number of intersections
- std_dev : permutations' standard deviation
- z_score : permutation test's z-score
LocalZ Key/Values
- shifts : list of z-scores for each shift
- step : step size used
- window : window size used
Using python with seaborn:
import json
import seaborn as sb
import matplotlib.pyplot as plt

# Load results and get the test information for plotting
results = json.load(open("regioners_output.json"))
test = results['test']
# Draw the permutations' distribution
p = sb.histplot(data=test, x="perms",
                color='gray', edgecolor='gray', kde=False, stat='density')
p = sb.kdeplot(data=test, x="perms",
                color='black', ax=p)
# Draw a line at the observed intersections
obs = test['observed']
plt.axvline(obs, color='blue')
# Draw a box for annotation
props = dict(boxstyle='round', facecolor='wheat', alpha=0.9)
y = 0.007
plt.text(obs, y, 'observed intersections',rotation=90, bbox=props, ma='center')
p.set(xlabel="Intersection Count", ylabel="Permutation Density")
plt.show()

# Plot the local z-scores
local_z = results["localZ"]
p = sb.lineplot(x=range(-local_z["window"], local_z["window"], local_z["step"]), y=local_z['shifts'])
p.set(title="Local z-score values", xlabel="Shift", ylabel="z-score")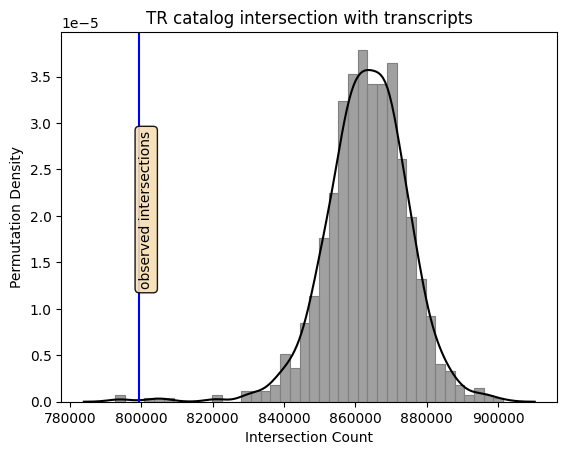
- gzip file reading