These are some scripts to analyse the data sets published by SciHub. You can find some analysis and texts about insights already won from the data at Science and the DataDryad Blog.
I wrote a blogpost based on the analyses done with this code which you might want to check out for some context. There's also a follow up blogpost by me on how to integrate the information on whether access was made from universities or now.
Run download_time_analysis.R and pass one of the *.tab files, yields a graphs/download_time.pdf. Watch out: The time zones are not taken into account, everything's UTC. For that reason there are two filtered files in graphs/, one for Hong Kong (UTC+7) and one for Germany (UTC+1) as examples.
Handling the complete files on my poor little notebook and in R was bit too much, so for looking at country-wise statistics I decided to calculate the aggregates the lazy bioinformatics-way:
cut -f 4 *.tab|sort|uniq -c|sort -n|awk '{out=$1"\t"; for(i=2;i<=NF;i++){out=out" "$i}; print out}' > countrywise.csv
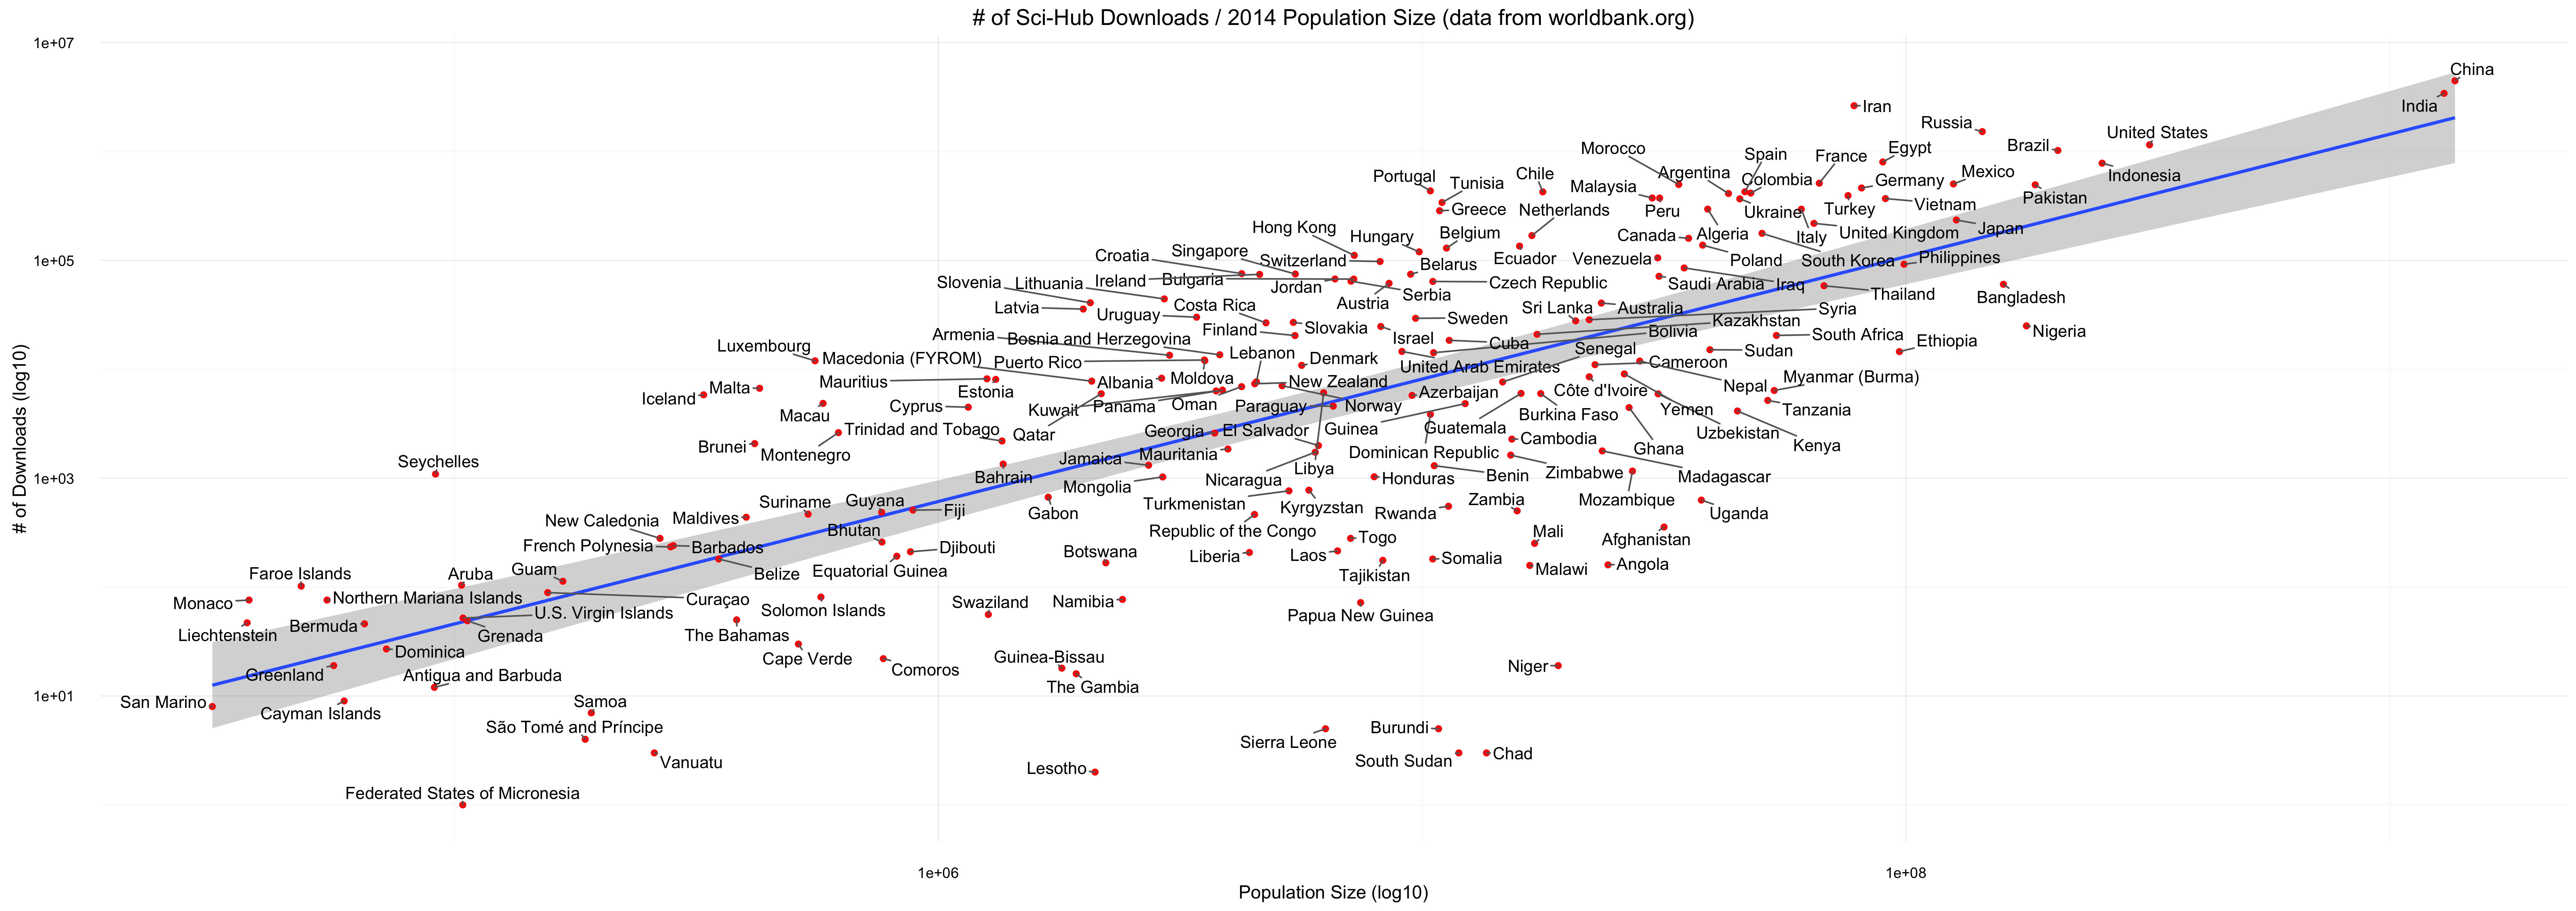
The World Bank offers the Population Sizes for 214 countries/economies as of 2014, amongst other file types as a csv. I used those and for now manually matched those to the countries listed in the SciHub data. Results are in country_downloads_population.csv (If no match could be made I just removed the country for now). The population numbers are in 1.000's.
This file is used by population_analysis.R to analyze how the population size and number of downloads are connected (graphs/downloads_per_population.pdf). Fitting a glm on the data the script also gives you the residuals, ranking which countries have how much more/less downloads than one would expect (graphs/downloads_per_population_residuals.pdf).
Last but not least the script also gives you the number of downloads per 1.000 inhabitants (graphs/downloads_per_population_ranked.pdf).
I was lucky enough to be put in touch with Sci-Hub and they used this list to classify their data on whether it comes from university IP ranges or not. For privacy reasons the data is more highly aggregated. A blog post on these analyses can be found here.
The first data set (uni-stats-date.tab) contains the percentage of academic downloads for a given day.
2015-09-01	6.86
2015-09-02	7.14
2015-09-03	6.99
2015-09-04	6.62
2015-09-05	3.69
2015-09-06	3.58
2015-09-07	6.69
2015-09-08	6.93
The second one (uni-stats-country.tab) contains the percentage of academic downloads for each 10 days, split by country:
2015-09-0*	Colombia	13.49
2015-09-0*	United States	5.98
2015-09-0*	China	5.65
2015-09-0*	Chile	11.88
2015-09-0*	Portugal	0.01
2015-09-0*	Morocco	0
2015-09-0*	Croatia	0
2015-09-0*	Egypt	8.2
The R scripts use ggplot2, ggrepel, ggthemes and lubridate.
It's available at DataDryad, so it's not included here. Download it from there.
The times in the data set are all in UTC+3 (it said UTC earlier, but I was corrected on that), so you'll have to adjust them for the corresponding time zones if interested in analyzing those. Or you could just ignore it for now as I did above, because I'm lazy.
The Sci-Hub data is CC-Zero, as indicated on DataDryad. The World Bank uses their own ToS for the data. My uglyish code is under MIT license, please take it.
Most definitely, I'm happy for everyone who likes to join me or has suggestions in what to analyze next! Get in touch through the issues or via Twitter.