This small js library listens to audio sources and extracts the underlying rhythmic information. The linear frequency energies are converted into midi notes which music theory suggests to be a better segregation for music audio.
A set of meaningful measurements are produced in a form suitable for direct use in webgl shaders, or any other context. This simple flow provides a powerful framework for the rapid development of awesome audio reactive visualisations.
Rayglider A powerful glsl sandbox with built in clubber support.
Clubber Tool - A web app for prototyping audio reactive visualizations. This is the best place to start playing around with clubber as it can export the patches you create for use in your own applications. It also happens to be a first class tool for music analysis and thanks to web midi output a very advanced sidechaining mechanism. This can come handy for driving parameters on external software, ranging from djing and music production to driving visuals. Everything that accepts midi control change messages basically.
A short introduction to the music vectorization technique on Medium.com
Some example patches for your audiovisual enjoyment:
Older but still good: Sea, Sun & Zorba, Cubes & Roses, Electro Fractal Land, Bello Electro, Boom Generators
Clubberize - A helper lib to utilize the tool's modulators in js apps, webgl or other.(Mostly obsolete now since the tool can export its state in pure javascript)
To embed this library in your project, include this file:
For the unminified version for local development (with source maps), include this file:
First install from npm:
npm install clubberAnd in your Browserify/Webpack modules, simply require the module:
require('clubber')First we instantiate a Clubber object and have it listen to an audio element. When we need to process a fresh set of audio samples we call Clubber.update(). This will usually need to be performed once per render iteration when live or when a new buffer is available when offline. Mind that in the later case the appropriate time needs to be provided manually to clubber.update(time). That time should be an incrementing sum of 1000 * /
var clubber = new Clubber({
    size: 2048, // Samples for the fourier transform. The produced linear frequency bins will be 1/2 that.
    mute: false // whether the audio source should be connected to web audio context destination.
});

// Specify the audio source to analyse. Can be an audio/video element or an instance of AudioNode.
clubber.listen(audioSource);

clubber.update(currentTime); // currentTime is optional and specified in milliseconds.
console.log(clubber.notes); // This is the array containing the audio energy per midi note.
The energy per midi note will be contained in the Clubber.notes array. A mechanism for analysis is provided by the library called 'bands'. These are implemented as closures that, when called, will process the current note energies and update Float32Arrays | Arrays | THREE.VectorX objects passed as the first argument, with the second argument being an offset for the case when arrays are used. Their output data can be passed directly to webgl shaders as vecs. The data coming out are readily usable as modulators but they can also be aggregated through time for more elaborate transitions etc.
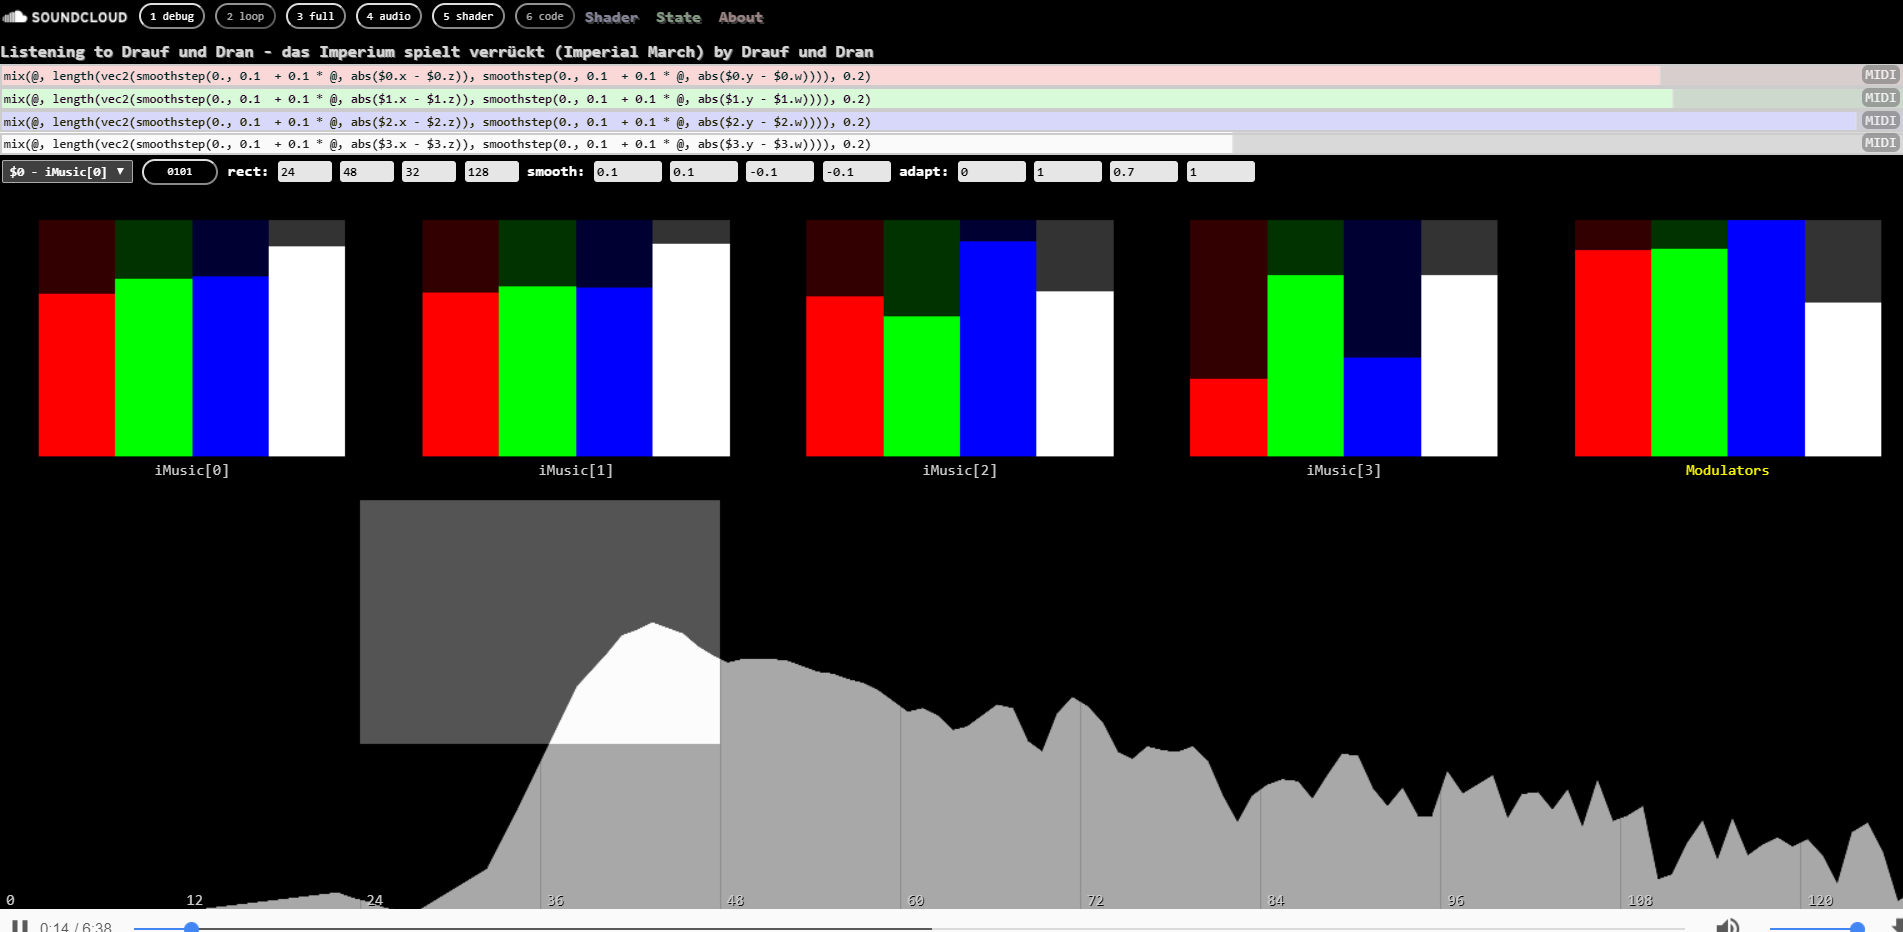
Bands are defined as rectangular windows on the midi spectrum using the properties from - to to declare a horizontal range of midi notes(0-127) to watch and low - high properties for the vertical power thresholds within that window, expressed as midi velocities (0-127). The output measurements are always normalized floats(0-1).
The output can be customized with the template property. This accepts a string of digits or an array of indices to select the desired measurements among a collection of the following:
- ID - Description
- 0 - Strongest power note index
- 1 - Weakest powered note index
- 2 - Power weighted note average
- 3 - Power of the strongest note
- 4 - Average energy of active notes
- 5 - Power weighted average midi index
- 6 - Power weighted average octave index
- 7 - Ratio of spectrum window area covered
- 8 - Adaptive low threshold relative to absolute limits
- 9 - Adaptive high threshold relative to absolute limits
If a template is not specified it defaults is 0123, the first four measurements from the set. The length of the string | array provided as the template defines the size of the resulting vector and the internally used Float32Array.
Bands also provide exponential smoothing for the measurements which is controlled by the smooth option. This takes an element array of normalized floats, same length as the template property, to use as factors for the smoothing of each respective measurement. A value of 1 means instant change and as it goes down to 0 it smooths more.
A negative value for an element activates the snap mode. In this mode when the energy rises it gets smoothed by the factor defined as the snap option which should normally be fast (default is 0.33 which is pretty fast) and when falling, it instead uses the abs(value) as the factor. This comes in handy for eg kicks which you would want the value to rise fast but slowly fade down, so you would use something like -0.1 or something like that. There's a single snap factor for all measurements of the object and it can be overriden in the options.
var band = clubber.band({ // clubber here is the instantiated object from above
    template: "0123", // alternately [0, 1, 2, 3]
    from: 1, // minimum midi note to watch
    to: 128 // maximum midi note, up to 160
    low: 64, // Low velocity/power threshold
    high: 128, // High velocity/power threshold
    smooth: [0.1, 0.1, 0.1, 0.1], // Exponential smoothing factors for the values
    adapt: [1, 1, 1, 1], // Adaptive bounds setup
    snap: 0.33
});

// This should happen first for the frequency data to be current
// Time is optional but is useful for performing offline analysis
clubber.update(currentTimeInMs);

// Calling the closures fills the provided object which can be Float32Array|Array|Three.VectorX
var bounds = band(vec4Object); // Returns object with from to low high bounds of the adapted window
The adapt option enables the adaptive mode for the low and high thresholds. In this mode the low and high options become the absolute limits for the thresholds but the actual vertical range of the window constantly adjusts within these limits by following the average energy of the band/rect. The option is defined as an array of normalized floats with the 4 following elements:
- the ratio of max height of the band/rect below the average energy for the low threshold
- a smoothing factor for the lower threshold
- the ratio of max height of the band/rect above the average energy for the high threshold
- a smoothing factor for the upper threshold
max height would be the high - low options, ie the absolute limits for the thresholds.
The smoothing factors work similarly to the ones for the measurements, including the snap mode.
To get an idea of how it works in practice click here and select the spectrum mode(click the views button twice). The green band will be adaptive. Check the Clubber Tool section for details on how to configure and use the utility.
Sometimes the audio source maybe located away from the box doing the presentations. In that case you can setup a minimal clubber app(no bands defined) to listen to the audio and perform the fft -> midi transform, extract the clubber.notes array and transmit them to another. You can then import them on the rendering box like this:
// The third(true) argument indicates that the data are already converted to midi space
clubber.update(time, noteArray, true);
There's no need to listen to anything on the rendering box in this case. You just create and use bands as usual. Time is optional and you can just provide it with a null value to use performance.now() internally.
Usually one would instantiate several bands, each covering a range of midi notes, low mid high etc, calling them every render iteration and passing the returned arrays/vec4s as uniforms to modulate webgl shaders. Other uses are equally easy, just pick and use elements from the arrays as needed.
By creatively combining the results of the analysis, the rhythmic patterns in the music will emerge in the graphics as well. Simple combinations could be finding the min/max between adjacent band notes/energies or multiply/sub them.
A strategy that works well would be to interpret the analysis results as vectors and operate on these. For instance map a bands strongest note on the x axis, the average note on the Y axis and calculate the length of the vector. You can go further and combine notes with powers and elements from different bands/rects.
And since we're dealing with vectors why not just measure their distances or even dot them to calculate the angle beetween them and see what comes out(Good stuff :) These combinations are all plausible, you can check some of them in the glsl demos that come with the source. You can also experiment on your own and design your modulators in this very helpful tool. If you come up with something good, please consider sharing.
AFRAME component & demo by wizgrav
Dancing Torus by jiin - wizgrav's remix
Copernicus - featuring Mike Gao's track Adventura
Several shaders by alvarobyrne
Neri Barnini neri.barnini@gmail.com
Fabien Motte hello@fabienmotte.com
This program is free software and is distributed under an MIT License.