Possible memory leak when v-for in development mode #8507
Comments
|
It seems there is a leak in non-production mode only. You should be fine in production |
|
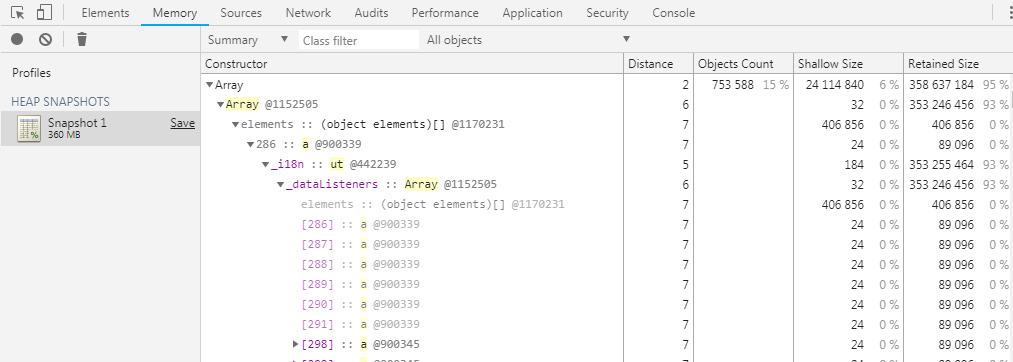
Thanks for the return @posva . I also created an issue on vue-i18n, since the memory usage gets way too heavy when using it. I don't know how much these can be related, but these two packages together with some complex or deeper components structure are taking a lot of memory usage even on production mode. Looking into Google task manager, my app tab increases by ~2.400K each item I scroll down/up (each one is destroyed/created in the processes). I'm not used to the core code of vue or vue-i18n, but It looks like the installed components structure are getting copied for each nested component in the app, and the GC can't clean that up after destroy that nested components. It can be the way vue-i18n installs itself, I really don't know. The data below is what makes me think about that:
|
|
I have the same issue, any advance about this? |
Version
2.5.16
Reproduction link
https://codepen.io/anon/pen/KBMaOY
Steps to reproduce
What is expected?
Same memory usage after garbage collector
What is actually happening?
Despite the "Performance" tab displays the same memory usage, the "Memory" heap snapshot displays a memory increase.
Also, the both Chrome and OS task managers show the memory only increasing.
It get worse when:
Tested on:
Please, consider that:
The text was updated successfully, but these errors were encountered: