High CPU usage after restart #2139
Comments
|
@GoushikaaMoorthi What VerneMQ packages do you use? self-built or EULA-based? 👉 Thank you for supporting VerneMQ: https://github.com/sponsors/vernemq |
|
|
@GoushikaaMoorthi 👉 Thank you for supporting VerneMQ: https://github.com/sponsors/vernemq |
|
Yes, we are setting |
|
@GoushikaaMoorthi then you are using the packages in non-compliant fashion. Please get in touch for clarification (info at vernemq.com) 👉 Thank you for supporting VerneMQ: https://github.com/sponsors/vernemq |
|
We will check into it. But will this impact CPU usage? |
|
potential fix: #2162 👉 Thank you for supporting VerneMQ: https://github.com/sponsors/vernemq |
|
@GoushikaaMoorthi any update? 👉 Thank you for supporting VerneMQ: https://github.com/sponsors/vernemq |
|
Hi, I can confirm the issue is still happening on VerneMQ version 1.13.0 |
|
@localbubble can you tell us what you did to see it? Here's a bit of context: a VerneMQ cluster needs handling of node leaves/joins and restarts in a more careful way than what might be expected, since it's not a stateless cluster. One of the points would be that joining nodes should be empty, that is not already loaded with traffic or history. If not, the result might be "empty synchronization" attempts leading to increased CPU. 👉 Thank you for supporting VerneMQ: https://github.com/sponsors/vernemq |
|
Hi @ioolkos We're using the VerneMQ helm chart for deployment (version 1.9.0), and our deployment uses PVCs for the VerneMQ statefulsets. We produce our own VerneMQ docker image for the deployment (version 1.13.0). The docker image we're producing for VerneMQ is pretty much the same with the official VerneMQ docker image, and if needed, I can provide more details about both the helm chart and the docker image. But as a rule of thumb, we try our best to stick to the defaults, meaning we don't have any customizations neither for the docker image creation nor for the helm chart usage, and we're simply replicating the official way of creating the docker image. On top of the docker image, we have the following two custom plugins.
This high CPU consumption issue is not happening on the initial deployment for our 2 clusters. The issue sometimes happen after we simply restart VerneMQ without any changes for a maintenance operation and/or it sometimes happen after we change some configurations on VerneMQ, like an environment variable change for user/password, therefore causing a restart on the VerneMQ pods. Unfortunately, I haven't seen any unusual/weird logs once this issue is triggered, and the only thing we see is that CPU consumption is increased drastically, from 100m to 2000m-3000m, and causing high pressure on the node that is deployed. And the workaround we found is to simply restart the VerneMQ cluster until the CPU consumption is back to normal. Lastly, this issue happens on our both clusters where, in one cluster we have around 20 clients connected in total and in the other cluster, there are more than 4000 clients connected. Please let me know if I should provide more information, Best Regards! |
|
My recommendation would be to check which erlang processes are causing the huge memory load, e.g. with recon & friend. That might give a hint for further investigation. |
We are running vernemq in AWS EKS setup. Below are the setup details
Vernemq version: 1.12.3
No of pods: 3
OS: Bottlerocket OS
EKS version: 1.24
Machine type: m5.2xlarge
After Os update from AWS linux to bottlerocket, subsequent EKS version upgrade results in increase in CPU usage
Expectation:
CPU usage should remain same as before after restart
*Actual Behaviour:


After restart CPU usage keeps on increasing. There is no increase in no of MQTT connections.
CPU Usage:
Connections:
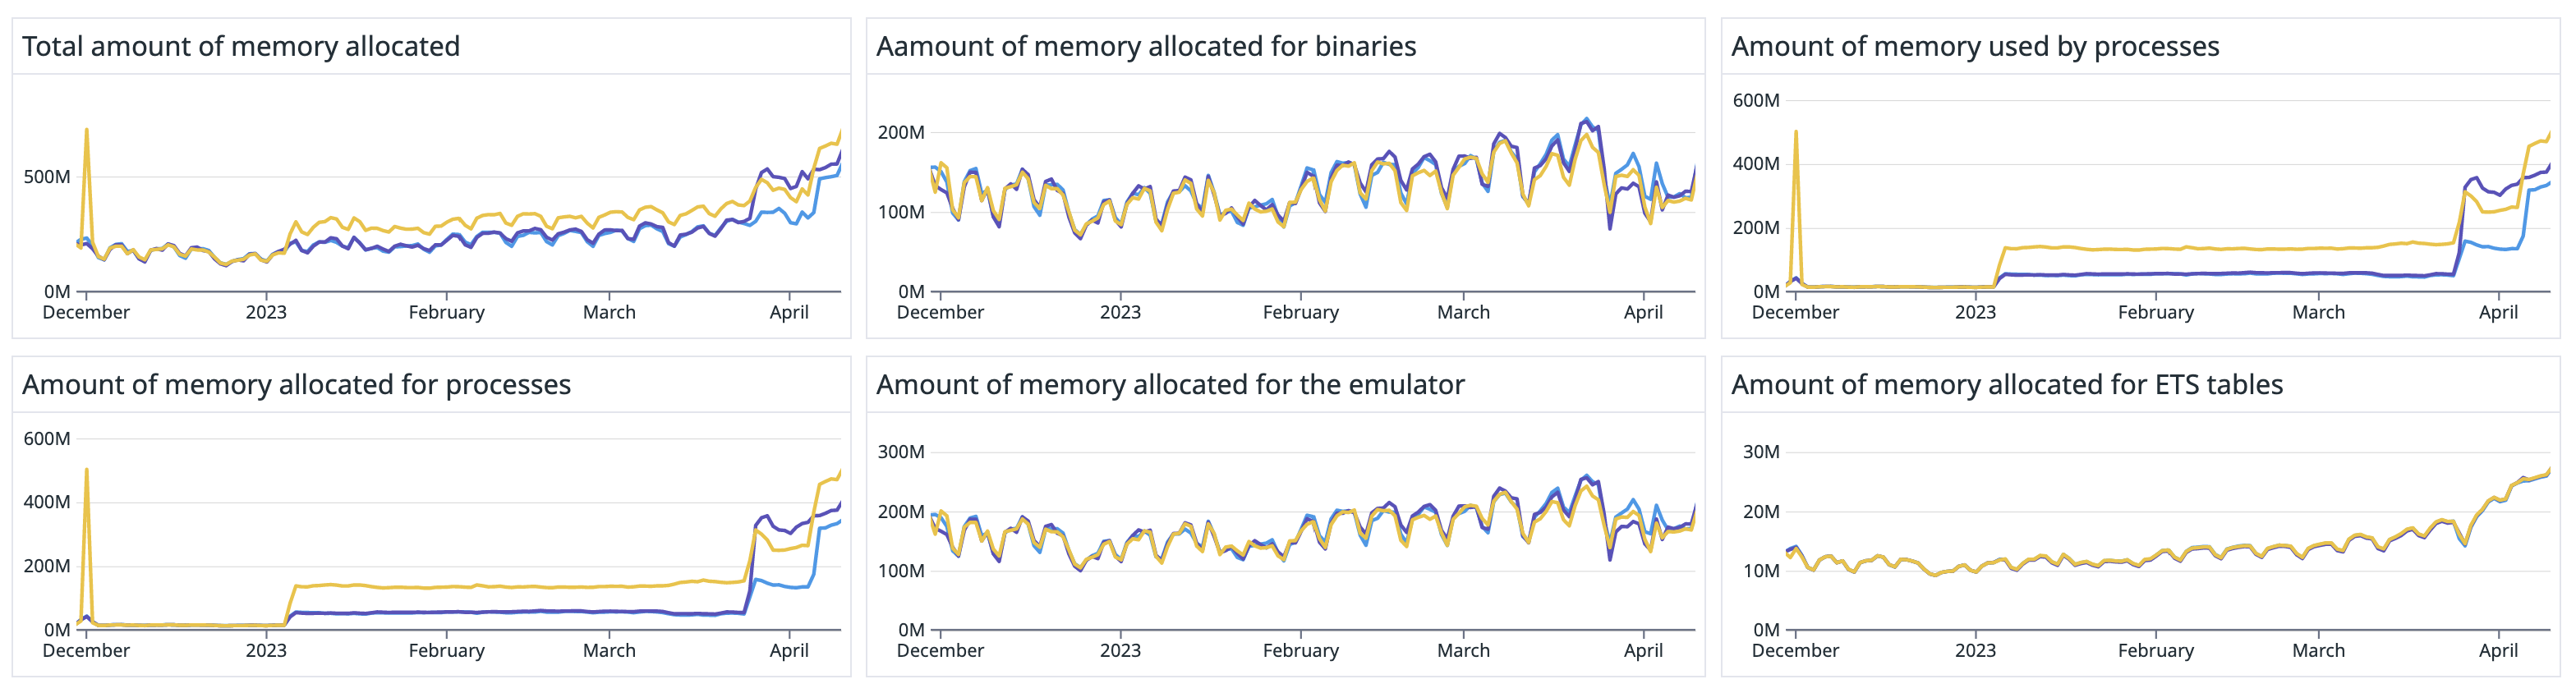
We could also see the difference in queue and memory allocation metrics

Queue:
Memory Allocation:
will the increase in queue initialisation be the reason for increase in CPU usage?
We also tried the options suggested in this issue, but the increase in CPU usage remains the same
The text was updated successfully, but these errors were encountered: