[Bug]: memory keeps growing #2130
Comments
|
What does your first figure show exactly? 👉 Thank you for supporting VerneMQ: https://github.com/sponsors/vernemq |
|
The first figure show memory usage of vernemq process. When I migrate the connections to other VerneMQ clusters, the memory used by the current VerneMQ cluster does not decrease. Does this mean that the memory is not taken up by the tcp buffer? Is the memory usaged by the vernemq process mainly composed of gauge.vm_memory_total and leveldb.maximum_memory, but my actual situation is that the memory usaged by the vernemq process is 6G more than gauge.vm_memory_total+leveldb.maximum_memory. |
|
I still don't see what exact metric your first figure shows. Should you have any additional findings based on your investigation, please share them. 👉 Thank you for supporting VerneMQ: https://github.com/sponsors/vernemq |
|
The exact metric shown in the first figure is provided by node-explorer: |
|
|

|
Can you show the ouput of 👉 Thank you for supporting VerneMQ: https://github.com/sponsors/vernemq |
bin/vmq-admin metrics showcounter.mqtt_unsubscribe_received = 667799 gauge.system_utilization_scheduler_13 = 11 gauge.system_utilization_scheduler_8 = 14 gauge.system_utilization_scheduler_3 = 11 counter.mqtt_subscribe_auth_error = 0 counter.bytes_sent = 2125880002850 counter.mqtt_connack_sent = 162760343 gauge.system_utilization_scheduler_11 = 8 |
bin/vmq-admin metrics show | grep memorygauge.vm_memory_processes = 128668664 |
|
@spalagu I don't know why RESident memory shows at 20.5 GB. As mentioned previously, I'd investigate for memory fragmentation.
👉 Thank you for supporting VerneMQ: https://github.com/sponsors/vernemq |
|
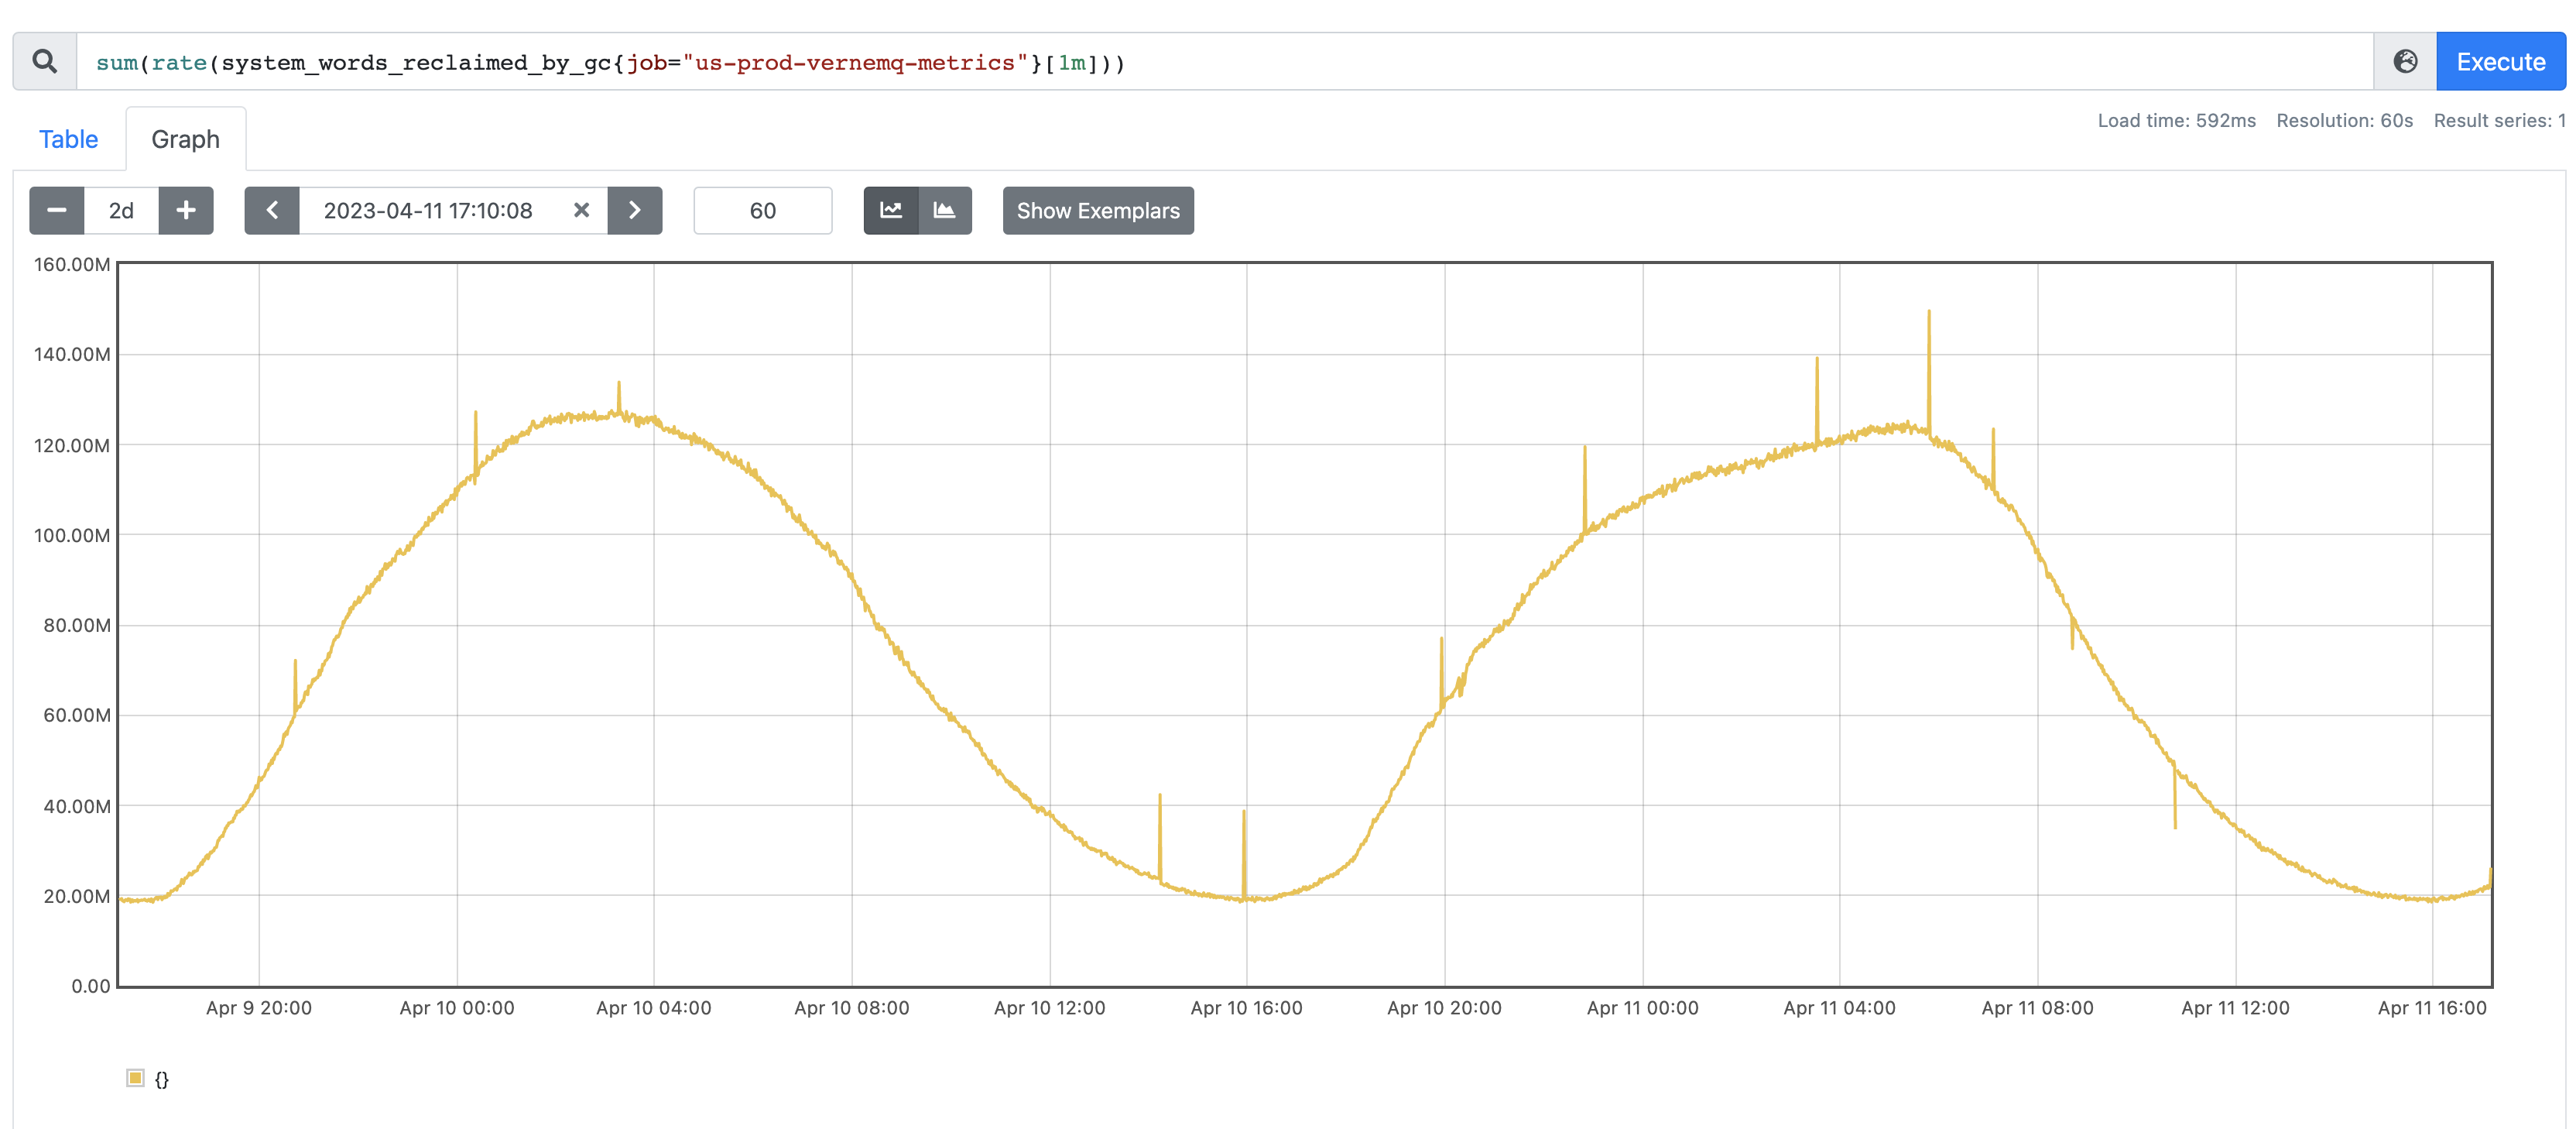
The "queue_message_drop" metric has a sudden increase, which does not occur most of the time in normal circumstances, and it seems to coincide with the time when garbage collection("system_words_reclaimed_by_gc" metric) occurs.
|

Environment
Current Behavior
VerneMQ's memory keeps growing for two weeks after startup without a large increase in the number of connections.
Below are the memory-related metrics of vernemq:
./bin/vmq-admin metrics show|grep memory
gauge.vm_memory_code = 15375612
gauge.vm_memory_processes_used = 125731120
gauge.vm_memory_ets = 1057110688
gauge.vm_memory_system = 5422875664
gauge.vm_memory_binary = 4314718624
gauge.vm_memory_atom_used = 714673
gauge.retain_memory = 669219520
gauge.swc_dotkeymap_memory = 38943376
gauge.vm_memory_processes = 126363800
gauge.vm_memory_atom = 729321
gauge.vm_memory_total = 5549239464
gauge.router_memory = 25253688
And my levedb memory parameter is(my ec2's memory is 30G in total):
leveldb.maximum_memory.percent = 20
The following figure shows the growth curve of VerneMQ memory after VerneMQ starts, I found that vernemq memory usage is not equal to gauge.vm_memory_total + leveldb.maximum_memory
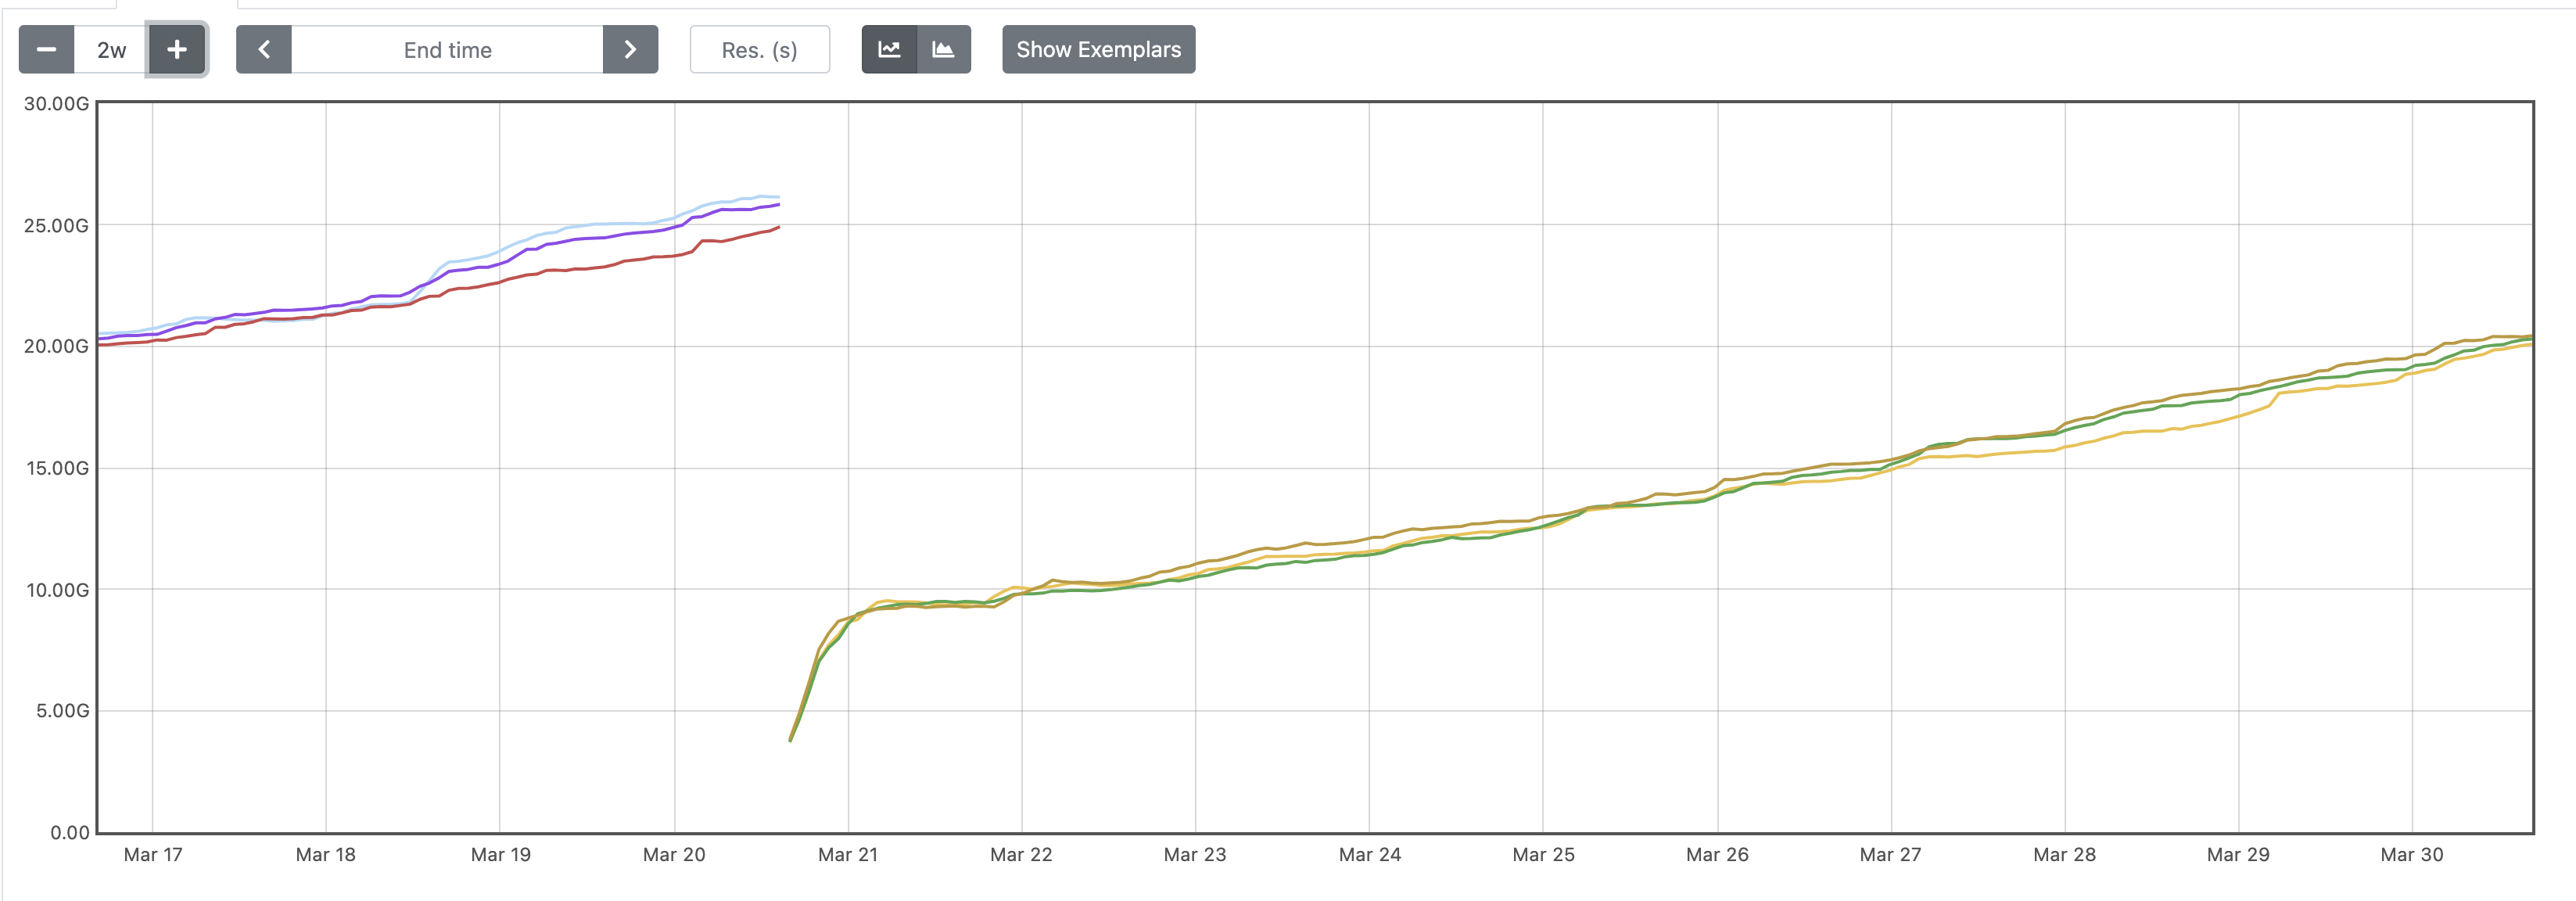
The following figure shows the growth curve of gauge.vm_memory_total

Expected behaviour
I hope to find the reason for the continuous growth of memory, or which metric is the main focus of memory growth
Configuration, logs, error output, etc.
Code of Conduct
The text was updated successfully, but these errors were encountered: