Skip to content
New issue

Have a question about this project? Sign up for a free GitHub account to open an issue and contact its maintainers and the community.

By clicking “Sign up for GitHub”, you agree to our terms of service and privacy statement. We’ll occasionally send you account related emails.

Already on GitHub? Sign in to your account

Exporting to png adds grid lines. #1323

Closed
PBI-David opened this issue Apr 15, 2023 · 3 comments
Closed

Exporting to png adds grid lines. #1323

PBI-David opened this issue Apr 15, 2023 · 3 comments

Comments

@PBI-David
Copy link

Vega-Editor ecaed13

Spec image in editor:

image

Spec image when I click Export as PNG in the editor
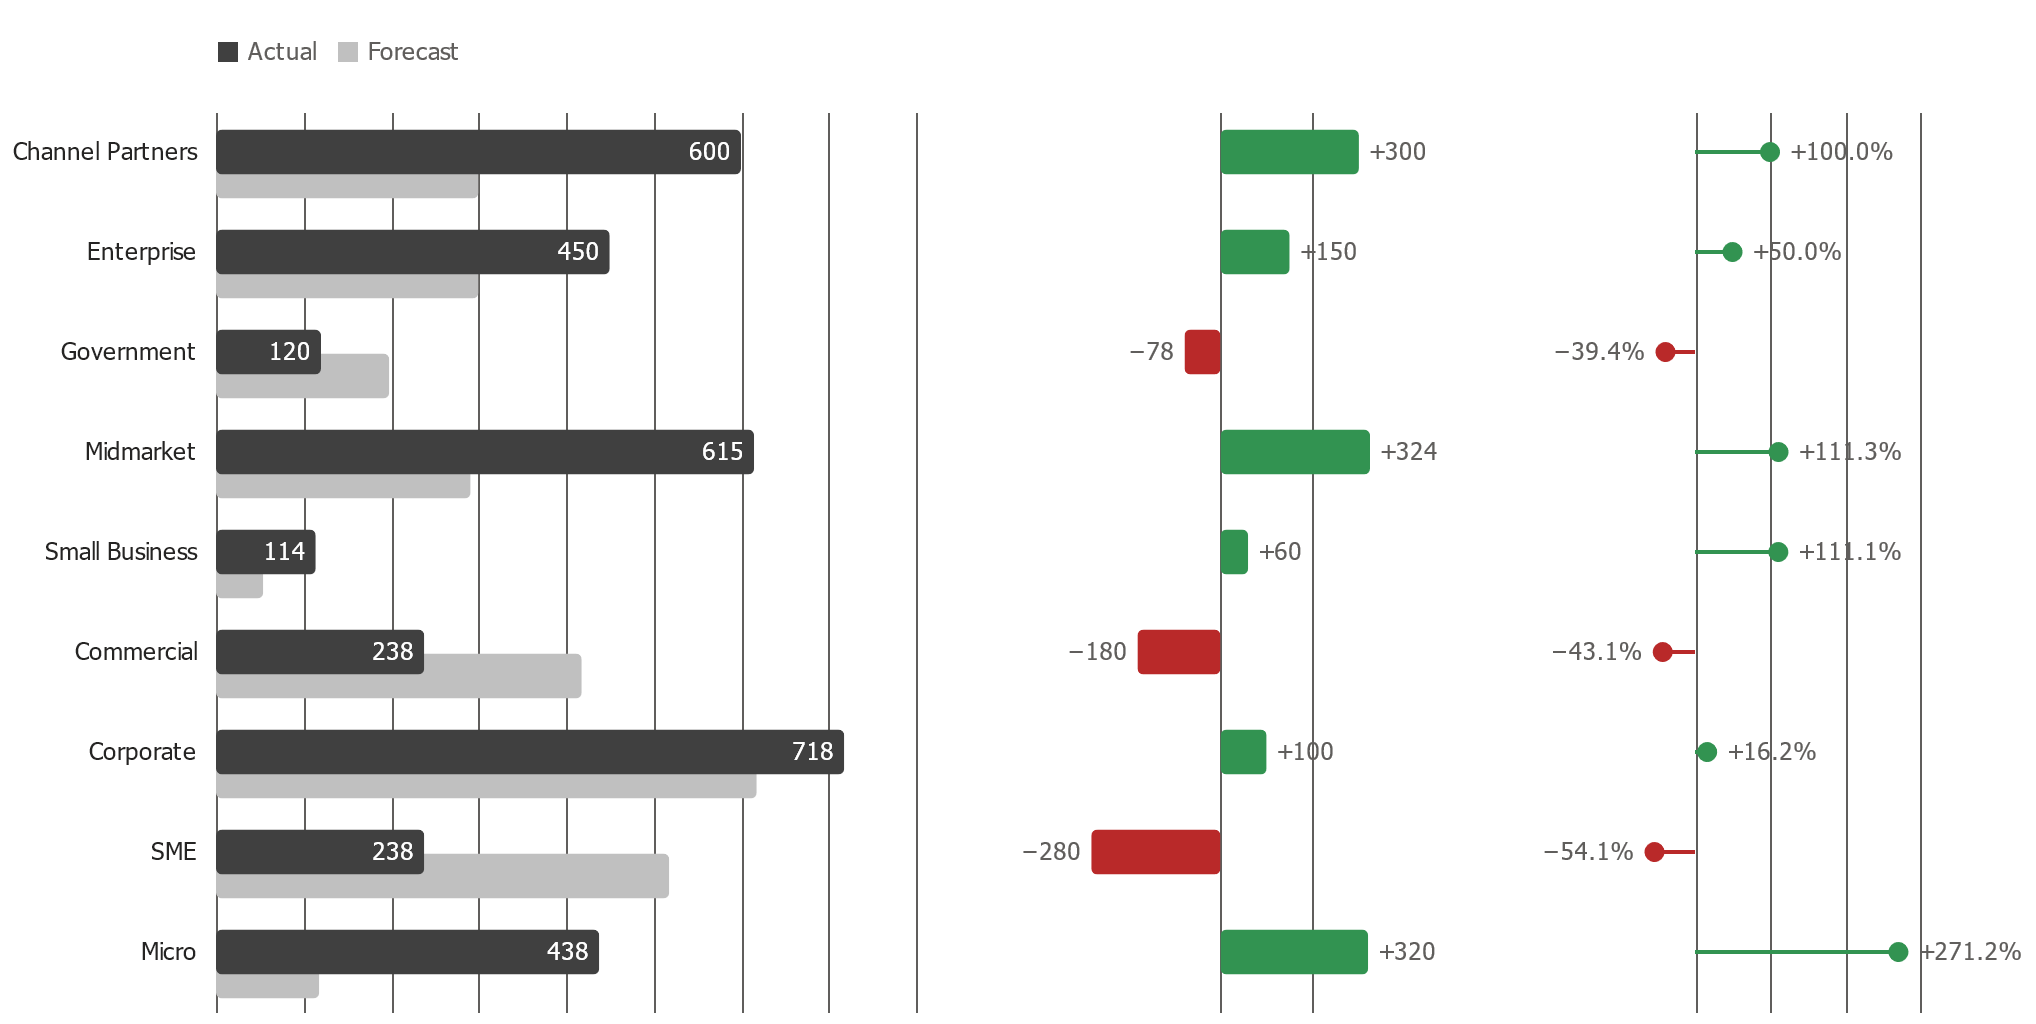
visualization

Full spec:

{
	"$schema": "https://vega.github.io/schema/vega-lite/v5.json",
	"data": {
		"name": "dataset",
		"values": [
			{ "BU": "Channel Partners", "Actual": 200, "Forecast": 100, "Index": 1 },
			{ "BU": "Enterprise", "Actual": 150, "Forecast": 100, "Index": 3 },
			{ "BU": "Government", "Actual": 40, "Forecast": 66, "Index": 2 },
			{ "BU": "Midmarket", "Actual": 205, "Forecast": 97, "Index": 4 },
			{ "BU": "Small Business", "Actual": 38, "Forecast": 18, "Index": 5 },
      { "BU": "Commercial", "Actual": 238, "Forecast": 418, "Index": 5 },
      { "BU": "Corporate", "Actual": 718, "Forecast": 618, "Index": 5 },
      { "BU": "SME", "Actual": 238, "Forecast": 518, "Index": 5 },
      { "BU": "Micro", "Actual": 438, "Forecast": 118, "Index": 5 }		]
	},
	"transform": [
		{
			"aggregate": [
				{ "op": "sum", "field": "Actual", "as": "Actual" },
				{ "op": "sum", "field": "Forecast", "as": "Forecast" }
			],
			"groupby": ["BU"]
		},
		{
			"calculate": "datum['Actual'] - datum['Forecast']",
			"as": "Variance Absolute"
		},
		{
			"calculate": "datum['Actual']/datum['Forecast']-1",
			"as": "Variance Percent"
		}
	],
	"hconcat": [
		{
			"width": 350,
			"height": { "step": 50 },
			"view": { "stroke": "transparent" },
			"encoding": {
				"color": {
					"type": "nominal",
					"scale": {
						"domain": ["Actual", "Forecast"],
						"range": ["#404040", "silver"]
					},
					"legend": { "title": null, "orient": "top" }
				},
				"y": {
					"field": "BU",
					"type": "nominal",
					"sort": { "field": "Index", "op": "sum", "order": "ascending" },
					"axis": { "domain": false, "offset": 0, "ticks": false, "title": "" }
				},
				"x": {
					"type": "quantitative",
					"axis": {
						"domain": false,
						"labels": false,
						"title": null,
						"ticks": false,
						"gridWidth": 1,
						"gridColor": {
							"condition": { "test": "datum.value === 0", "value": "#605E5C" },
							"value": "#transparent"
						}
					}
				}
			},
			"layer": [
				{
					"mark": {
						"type": "bar",
						"tooltip": true,
						"cornerRadius": 3,
						"yOffset": 12,
						"height": { "band": 0.5 }
					},
					"encoding": {
						"x": { "field": "Forecast" },
						"color": { "datum": "Forecast" },
						"opacity": {
							"condition": {
								"test": { "field": "__selected__", "equal": "off" },
								"value": 0.3
							}
						}
					}
				},
				{
					"mark": {
						"type": "bar",
						"tooltip": true,
						"cornerRadius": 3,
						"yOffset": 0,
						"height": { "band": 0.5 }
					},
					"encoding": {
						"x": { "field": "Actual" },
						"color": { "datum": "Actual" },
						"opacity": {
							"condition": {
								"test": { "field": "__selected__", "equal": "off" },
								"value": 0.3
							}
						}
					}
				},
				{
					"mark": {
						"type": "text",
						"align": "right",
						"dx": -5,
						"color": "white"
					},
					"encoding": {
						"x": { "field": "Actual" },
						"text": { "field": "Actual", "type": "quantitative", "format": "," }
					}
				}
			]
		},
		{
			"width": 150,
			"height": { "step": 50 },
			"view": { "stroke": "transparent" },
			"encoding": {
				"y": {
					"field": "BU",
					"type": "nominal",
					"sort": { "field": "Index", "op": "sum", "order": "ascending" },
					"axis": null
				},
				"x": {
					"field": "Variance Absolute",
					"type": "quantitative",
					"axis": {
						"domain": false,
						"labels": false,
						"title": null,
						"ticks": false,
						"gridWidth": 1,
						"gridColor": {
							"condition": { "test": "datum.value === 0", "value": "#605E5C" },
							"value": "#transparent"
						}
					}
				}
			},
			"layer": [
				{
					"mark": {
						"type": "bar",
						"tooltip": true,
						"cornerRadius": 3,
						"yOffset": 0,
						"height": { "band": 0.5 }
					},
					"encoding": {
						"fill": {
							"condition": {
								"test": "datum['Variance Absolute'] < 0",
								"value": "#b92929"
							},
							"value": "#329351"
						},
						"opacity": {
							"condition": {
								"test": { "field": "__selected__", "equal": "off" },
								"value": 0.3
							}
						}
					}
				},
				{
					"mark": {
						"type": "text",
						"align": {
							"expr": "datum['Variance Absolute'] < 0 ? 'right' : 'left'"
						},
						"dx": { "expr": "datum['Variance Absolute'] < 0 ? -5 : 5" }
					},
					"encoding": {
						"text": {
							"field": "Variance Absolute",
							"type": "quantitative",
							"format": "+,"
						}
					}
				}
			]
		},
		{
			"width": 150,
			"height": { "step": 50 },
			"view": { "stroke": "transparent" },
			"encoding": {
				"y": {
					"field": "BU",
					"type": "nominal",
					"sort": { "field": "Index", "op": "sum", "order": "ascending" },
					"axis": null
				},
				"x": {
					"field": "Variance Percent",
					"type": "quantitative",
					"axis": {
						"domain": false,
						"labels": false,
						"title": null,
						"ticks": false,
						"gridColor": {
							"condition": { "test": "datum.value === 0", "value": "#605E5C" },
							"value": "#transparent"
						}
					}
				}
			},
			"layer": [
				{
					"mark": { "type": "rule", "tooltip": true },
					"encoding": {
						"strokeWidth": { "value": 2 },
						"stroke": {
							"condition": {
								"test": "datum['Variance Absolute'] < 0",
								"value": "#b92929"
							},
							"value": "#329351"
						},
						"opacity": {
							"condition": {
								"test": { "field": "__selected__", "equal": "off" },
								"value": 0.3
							}
						}
					}
				},
				{
					"mark": { "type": "circle", "tooltip": true },
					"encoding": {
						"size": { "value": 100 },
						"color": {
							"condition": {
								"test": "datum['Variance Absolute'] < 0",
								"value": "#b92929"
							},
							"value": "#329351"
						},
						"opacity": {
							"condition": {
								"test": { "field": "__selected__", "equal": "off" },
								"value": 0.3
							},
							"value": 1
						}
					}
				},
				{
					"mark": {
						"type": "text",
						"align": {
							"expr": "datum['Variance Absolute'] < 0 ? 'right' : 'left'"
						},
						"dx": { "expr": "datum['Variance Absolute'] < 0 ? -10 : 10" }
					},
					"encoding": {
						"text": {
							"field": "Variance Percent",
							"type": "quantitative",
							"format": "+.1%"
						}
					}
				}
			]
		}
	],
	"config": {
		"view": { "stroke": "transparent" },
		"padding": { "left": 5, "top": 20, "right": 5, "bottom": 5 },
		"font": "Segoe UI",
		"axis": {
			"labelFontSize": 12,
			"labelPadding": 10,
			"offset": 5,
			"labelFont": "Segoe UI",
			"labelColor": "#252423"
		},
		"text": { "fontSize": 12, "font": "Segoe UI", "color": "#605E5C" },
		"concat": { "spacing": 50 },
		"legend": {
			"labelFontSize": 12,
			"labelFont": "Segoe UI",
			"labelColor": "#605E5C"
		}
	}
}

@domoritz
Copy link
Member

The image has gridlines for me even without exporting.

Screenshot 2024-05-27 at 15 18 18

@PBI-David
Copy link
Author

@domoritz switch to the SVG renderer and you should observe the same as me.

@PBI-David
Copy link
Author

PBI-David commented May 27, 2024

Actually, I have spotted the issue. For some reason, my spec was using #transparent instead of just transparent. Seemed to be interpreted by SVG fine but obviously broke canvas. User error.

Sign up for free to join this conversation on GitHub. Already have an account? Sign in to comment
Labels
None yet
Projects
None yet
Development

No branches or pull requests

2 participants