Possible issue with entropy based centering #479
Comments
|
@dgursoy, implemented the From my understanding, you compared your IDL code with two of TomoPy's three automated As stated in the documentation, Since it does seem from your log output that the entropy value is decreasing, I suggest first trying a smaller |
|
@decarlof, do you have any tips for the robustness of |
I decreased tol from 0.5 to 0.1. That did not help. The new results are within 0.2 pixels of the previous results.
If you look at my plots of entropy in IDL you will see that they vary by about 0.02 units out of 7.75 when center is off by 10 pixels. This is about 0.26% for a 10 pixel error. With tomopy we see the following. This is the optimal value it found: Here is an evaluation at +13 pixels. Note that the function value differs from the optimal by 0.00068400, or 0.028%. This is 10x less than I am seeing in IDL for a similar pixel error. Here is an evaluation at -7 pixels. Note that the function value is exactly the same as at the optimum, within the digits that Python is printing! Something is wrong! I am beginning to suspect there is something wrong with the entropy calculation in tomopy.
The IDL exhaustive search over a range of 10 pixels takes 8.9 seconds. tomopy is taking 16 to 19 seconds with an optimized search, and is coming up with the wrong answer. 10 pixel range is generally all that is required for a particular set of experiments. One does a large range search for one dataset, and then a 10 pixel range should be OK for other datasets until the setup is changed. But if we can fix the tomopy algorithm then the optimized search should work without needing to know the approximate center. |
|
It seems there is something that needs to be fixed. The citation for find_center is https://doi.org/10.1364/JOSAA.23.001048; I will read it tomorrow. Do you have a reference that describes how to compute the entropy? I'm not familiar with this metric. |
|
The paper you cite is what I used in my IDL code. The paper explains how to compute the entropy. It is the sum of H*log(H) where H is the histogram of the image. The entropy is basically a measure of the sharpness of the histogram. My IDL code that does the entropy minimization is here: At first glance I see a major difference between my implementation and the one in tomopy. My code has these 2 lines: Since my binsize is 1e-4 of the difference between the min and max histogram values that means my histogram has 10,000 bins. tomopy rotation.py has this line: So tomopy is only using 64 bins in the histogram, rather than 10,000. I'm pretty sure that is at least part of the problem. When the reconstructions differ only slightly the histograms with only 64 bins will be very similar, if not identical. That is exactly what we seem to be seeing. I wrote the first version of the entropy minimization algorithm in that IDL file in 2007, which was the year after Donath's paper was written. My code has always been publicly available. |
|
I tested my idea that increasing the number of histogram bins from 64 to 10000 would fix the problem. I was wrong, it did not help. I then changed my test program to remove the air normalization and padding steps. I tested using the current version of tomopy/recon/rotation.py, not the version I modified to increase the histogram bins. This is the new test program. It uses both the entropy and 0-180 centering methods. In both cases tol=0.1. I changed the value of center_guess each time I ran the program. import tomopy
import dxchange
import logging
top_slice=120
bottom_slice = 1080
tol = 0.1
center_guess = 970
logging.basicConfig(
format='%(asctime)s %(levelname)-8s %(message)s',
level=logging.INFO,
datefmt='%Y-%m-%d %H:%M:%S')
logging.info('Reading data ...')
proj, flat, dark, theta = dxchange.read_aps_13bm('NaCl_A1.nc', file_format='netcdf4')
logging.info('Normalizing ...')
norm = tomopy.normalize(proj, flat, dark)
npad = 0
logging.info('Taking log ...')
norm = tomopy.minus_log(norm)
logging.info("")
logging.info('Finding centers with 0-180')
top_center = tomopy.find_center_pc(norm[0, top_slice:top_slice+10, :], norm[-1, top_slice:top_slice+10, :], rotc_guess=center_guess+npad, tol=tol)
bottom_center = tomopy.find_center_pc(norm[0, bottom_slice:bottom_slice+10, :], norm[-1, bottom_slice:bottom_slice+10 :], rotc_guess=center_guess+npad, tol=tol)
logging.info('top_center: %f, bottom_center:%f', top_center-npad, bottom_center-npad)
logging.info("")
logging.info('Finding centers with entropy, initial guess=%f', center_guess)
top_center = tomopy.find_center(norm, theta, init=center_guess+npad, ind=top_slice, tol=tol, mask=True)
bottom_center = tomopy.find_center(norm, theta, init=center_guess+npad, ind=bottom_slice, tol=tol, mask=True)
logging.info('top_center: %f, bottom_center:%f', top_center-npad, bottom_center-npad)These are the results.
Both methods are working quite well. The entropy method is giving differences of up to 0.9 pixels depending on the initial guess. That seems incorrect when tol=0.1, since one would expect the optimized value to be within I now need to figure out if it is the air normalization or the padding that is causing the entropy method to fail. |
|
@MarkRivers @carterbox I think there was some recent discussion here about how much FFT padding was happening with TomoPy's version of gridrec, with the conclusion that it should probably be increased (maybe by 2x). I don't know when that changed in the master branch, but you might check that as well - it might have a similar effect of changing the amount of air. There might also be a difference in whether the padding is truly adding zero or a value that is very small but has a valid logarithm. I might also wonder if it would be faster -- and possibly more stable -- to use |
|
I modified the program in the previous comment as follows, adding the call to tomopy.normalize_bg. logging.info('Normalizing ...')
norm = tomopy.normalize(proj, flat, dark)
logging.info('Secondary normalize to air ...')
norm = tomopy.normalize_bg(norm, air=10)These are the results:
So with air normalization the 0-180 method still works fine, but the entropy method fails completely. I then commented out the air normalization and added in padding to 2048 with mode='edge' as follows: logging.info('Normalizing ...')
norm = tomopy.normalize(proj, flat, dark)
#logging.info('Secondary normalize to air ...')
#norm = tomopy.normalize_bg(norm, air=10)
npad = int((2048 - norm.shape[2]) / 2)
logging.info('Padding to 2048, npad=%d', npad)
norm = tomopy.misc.morph.pad(norm, axis=2, npad=npad, mode='edge')
logging.info('Shape after padding %s', norm.shape)Here are the results:
So with padding the 0-180 method still works fine, but the entropy method fails completely. Conclusion |
|
I tried changing the padding to constant mode with a value of 1 as follows: These are the results:
Again the 0-180 method works fine but the entropy method fails completely. |
|
There are multiple issues with TomoPy's gridrec that need to be addressed. In fact, 5 of the 7 bugs on our bug board are gridrec related. @MarkRivers, did you check whether TomoPy's |
I am looking into it. I never use the entropy method but the find_center_vo which works well. |
|
A quick feedback after I read some of the comments. There are few differences from the IDL entropy based centering code that I remember. First, the ring correction is not implemented in ours and I remember it was ensuring some robustness. Second, NM optimizer can be replaced by a hierarchical brute search or by another optimizer as Matt suggested. I also remember that selection of histogram bins and some custom data treatments on the range is also important. |
|
Here is a comparison of 0-180, entropy, and Vo both with and without padding. Here I also list the execution time. The times listed are the times to center both the top slice and the bottom slice. No padding:
So Vo works, but it takes over 2 minutes using the default parameters. That is about 4 times longer than it takes to reconstruct the entire dataset! I have not tried a smaller coarse or fine search radius. @decarlof do you normally use a smaller search radius? 2048 padding:
|
The example I show at the beginning of this issue in IDL has ring correction disabled, so that cannot be the difference.
I don't believe the problem is the optimizer. The problem is, for example, that the entropy values for centers that are 7 pixels apart are identical (see my second comment from top of issue). That means the problem is either the entropy calculation, or the reconstruction itself. In IDL the entropy is a monotonically decreasing function over at least 30 pixels, and it should never have the same value 7 pixels apart (except for symmetry about the minimum).
I tried changing tomopy rotation.py to use the same logic as IDL (10000 bins, clipping histogram to 1 rather than adding 1e-12, etc.). But that did not help. I think the difference is probably in the reconstructions that gridrec is producing on the two systems. |
|
I am trying to track down why tomopy and IDL produce such different results for centering based on entropy. I first wrote a little program that reads in the same dataset as above, does the normalization in tomopy, and writes out slices 600 and 601 as TIFF files. That lets me start with the same input slice for both tomopy and IDL reconstructions and entropy minimization. I then wrote the following program in tomopy. It does the following:
This is the program: import tomopy
import numpy as np
import dxchange
import logging
import tifffile
import matplotlib.pyplot as plt
center_range = 40.
center_step = 0.25
center_guess = 960.
logging.basicConfig(
format='%(asctime)s %(levelname)-8s %(message)s',
level=logging.INFO,
datefmt='%Y-%m-%d %H:%M:%S')
centers = np.arange(center_guess-center_range, center_guess+center_range, center_step)
num_centers = centers.shape[0]
logging.info('Reading data ...')
slice = tifffile.imread('NaCl_norm_slice600.tiff')
num_projections = slice.shape[0]
nx = slice.shape[1]
slice = slice.reshape((num_projections, 1, nx))
slice = tomopy.minus_log(slice)
theta = np.arange(num_projections) * (np.pi / num_projections)
recon = tomopy.recon(slice, theta, algorithm='gridrec', sinogram_order=False)
hmin = recon.min()
if (hmin < 0):
hmin *= 2.0
else:
hmin *= 0.5
hmax = recon.max()
if (hmax < 0):
hmax *= 0.5
else:
hmax *= 2.0
data = np.repeat(slice, num_centers, 1)
entropy = np.empty(num_centers)
logging.info('Reconstructing single slice with %d different centers ...', num_centers)
recon = tomopy.recon(data, theta, centers, algorithm='gridrec', sinogram_order=False)
logging.info('Computing entropy ...')
for i in range(num_centers):
rec = recon[i,:,:]
hist, e = np.histogram(rec, bins=64, range=[hmin, hmax])
hist = hist.astype('float32') / rec.size + 1e-12
entropy[i] = -np.dot(hist, np.log2(hist))
logging.info('center=%f, entropy=%f', centers[i], entropy[i])
#p = plt.plot(centers, entropy)
#plt.show()
logging.info('Calling tomopy.find_center() ...')
tomopy_center = tomopy.find_center(slice, theta, init=center_guess, mask=False, ind=0, tol=0.1)
logging.info('tomopy_center=%f', tomopy_center)This is the output of that program, where I have deleted most of the printing of the entropy for each slice. This is a plot of the entropy computed for each of the 320 slices as a function of the rotation center.
The problem is clear! The entropy is not at a minimum near the rotation center of ~962.5 it is at a maximum! The entropy is very noisy. tomopy's find_center() happened to find the local minimum at 982.5. That is because it did not search down by 930, or up near 993, but the whole thing is clearly not working. The entropy should be a smooth function with a minimum near 962, not a noisy function with a maximum near 962. The next job is to duplicate the above program in IDL and compare the results. |

|
I realized that in the above test I was setting mask=False in tomopy.find_center(). That is not the default, and not what I was using in the tests above yesterday. I have modified the program to allow setting mask=True or False, and applying the mask in the program as well as in the call to find_center(). I also changed from testing with slice 600 to testing with slice 120, which is the top slice from the tests yesterday. It is also one of the slices tested with IDL in the first message in this issue. This is the new version of the program. import tomopy
import numpy as np
import dxchange
import logging
import tifffile
import matplotlib.pyplot as plt
center_range = 40.
center_step = 0.25
center_guess = 960.
mask = True
logging.basicConfig(
format='%(asctime)s %(levelname)-8s %(message)s',
level=logging.INFO,
datefmt='%Y-%m-%d %H:%M:%S')
centers = np.arange(center_guess-center_range, center_guess+center_range, center_step)
num_centers = centers.shape[0]
logging.info('Reading data ...')
slice = tifffile.imread('NaCl_norm_slice120.tiff')
num_projections = slice.shape[0]
nx = slice.shape[1]
slice = slice.reshape((num_projections, 1, nx))
slice = tomopy.minus_log(slice)
theta = np.arange(num_projections) * (np.pi / num_projections)
recon = tomopy.recon(slice, theta, algorithm='gridrec', sinogram_order=False)
hmin = recon.min()
if (hmin < 0):
hmin *= 2.0
else:
hmin *= 0.5
hmax = recon.max()
if (hmax < 0):
hmax *= 0.5
else:
hmax *= 2.0
data = np.repeat(slice, num_centers, 1)
entropy = np.empty(num_centers)
logging.info('Reconstructing single slice with %d different centers ...', num_centers)
recon = tomopy.recon(data, theta, centers, algorithm='gridrec', sinogram_order=False)
logging.info('Computing entropy ...')
if mask is True:
recon = tomopy.circ_mask(recon, axis=0)
for i in range(num_centers):
rec = recon[i,:,:]
hist, e = np.histogram(rec, bins=64, range=[hmin, hmax])
hist = hist.astype('float32') / rec.size + 1e-12
entropy[i] = -np.dot(hist, np.log2(hist))
logging.info('center=%f, entropy=%f', centers[i], entropy[i])
#p = plt.plot(centers, entropy)
#plt.show()
logging.info('Calling tomopy.find_center() ...')
tomopy_center = tomopy.find_center(slice, theta, init=center_guess, mask=mask, ind=0, tol=0.1)
logging.info('tomopy_center=%f', tomopy_center)This is the output This is the plot of entropy vs rotation center: Setting mask=True improves the behavior considerably. Now the entropy does have a minimum near the rotation axis. It is still rather noisy, and one can see how it can find a different local minimum near the true minimum because of the noise. I am quite sure the IDL code is not applying a mask. Perhaps tomopys implementation of gridrec is producing more noise outside the reconstructed circle than the IDL version? |

|
Yesterday I showed that tomopy.find_center() failed badly if air normalization was applied. I just changed the test program above to add the air normalization as follows: The program still has mask=True. This is the end of the output: This is the plot: So applying air normalization makes the entropy no longer have a minimum at the rotation center. tomopy.find_center is getting 1016.1, rather than 962. However, IDL seems to work fine with air normalization. |

|
I have now written an IDL program to perform similar functions to the Python program above. This program does the following:
This is the output of the program, the plot of the entropy, and the reconstructed image when the above program is run:
To my surprise this plot shows a noisy entropy and no clear minima, which is very different from the plot in the first post in this issue. The top center is 961.5 which is not too far from the correct value of 962.5, but the bottom center is far off. I figured out that the difference was my original post was using the "hann" filter in Gridrec, rather than the "shepp" filter. I thus changed the above program to use 'hann': and ran the program again. This was the result:
Now the entropy has a beautiful smooth shape with a clear minimum. The centers of both slices are at 962.5 The "hann" filter does some smoothing/noise reduction compared to the "shepp" filter. I then went back to the 'shepp' filter, but before reconstruction I smoothed the sinogram with a 2x2 boxcar filter by uncommenting these 2 lines in the program above: This is the result:
The result is nearly identical to using the 'hann' filter. So in order to get a good entropy minimization for centering it is necessary, at least with this rather noisy dataset, to either use the 'hann' filter or to do some smoothing on the slices before reconstruction. I then disabled the smoothing and changed the tomo_params to use the values we typically use when reconstructing:
This is the result:
The result of the entropy minimization is very similar. However, now the reconstructed image is improved. In all of the previous reconstructions the edge of the aluminum cylinder containing the sample has a bright edge. This is is a reconstruction artifact caused by the fact that the cylinder was slightly larger than the field of view. By doing the secondary normalization to air this artifact is removed. Note however, that this artifact did not appear to interfere with the entropy minimization. |


|
nice!
francesco
… On May 16, 2020, at 10:12, Mark Rivers ***@***.***> wrote:
I have now written an IDL program to perform similar functions to the Python program above.
This is the program:
; This program computes the entropy as a function of center position using
; Gridrec (tomoRecon version) in IDL

center_range = 40.
center_step = 0.25
center_guess = 960.

num_center = (center_range * 2)/center_step
center = (center_guess - center_range) + findgen(num_center) * center_step

print, 'Reading TIFF slices ...'
slice120 = read_tiff('NaCl_norm_slice120.tiff')
slice1080 = read_tiff('NaCl_norm_slice1080.tiff')

;slice120 = smooth(slice120,2)
;slice1080 = smooth(slice1080,2)

s = size(slice120, /dimensions)
num_pixels = s[0]
num_projections = s[1]
vol = fltarr(num_pixels, 2, num_projections)
vol[*,0,*] = slice120
vol[*,1,*] = slice1080

print, 'Initializing tomo_params ...'
tp = tomo_params_init(vol, airPixels=0, ringWidth=0, gr_filtername='shepp', paddedSinogramWidth=num_pixels, paddingaverage=0, sinoScale=1., reconScale=1.)

;help, tp, output=tp_text
;print, tp_text

print, 'Optimizing rotation center ...'
optimize_rotation_center, tp, [0,1], vol, center, entropy

print, 'Determining entropy minima ...'
e1 = entropy[*,0]
e2 = entropy[*,1]
mindiff = min(e1, minpos1) - min(e2, minpos2)
center1 = center[minpos1]
center2 = center[minpos2]
print, 'Center for slice 120:', center1
print, 'Center for slice 1080:', center2
print, 'Plotting results ...'
p1 = plot(center, e1, color='red', symbol='+', name='Slice 120')
p2 = plot(overplot=p1, center, e2+mindiff, color='blue', symbol='x', name='Slice 1080')
leg = legend(target=[p1,p2])

r = reconstruct_slice(tp, 0, vol, center=center1)
write_png, 'recon.png', bytscl(r)

end
This program does the following:
Creates an array of rotation centers to test, 960 +-40 in 0.25 pixel steps
Reads in the slice120 and slice1080 TIFF files that were created with tomopy. These are normalized to dark and flat, but have no other processing (log, etc.).
Puts those 2 slices into a 3-D array (2 slices).
Initializes the tomo_params structure that controls the Gridrec/tomoRecon reconstruction. The structure is initialized with:
airPixels=0. This disables secondary normalization to air on both sides of the image.
ringWidth=0. This disables ring artifact reduction.
gr_filtername='shepp' selects the Shepp-Logan filter for GridRec.
paddedSinogramWidth=num_pixels. num_pixels is the actual width of the projections, so this disables padding the sinogram.
paddingAverage=0. This disables any averaging of the border pixels if sinogram padding is enabled.
sinoScale=1. Disables any scaling of the input sinogram
reconScale=1. Disables any scaling of the output reconstruction.
Calls optimize_rotation_center. This does the following:
Calls tomoRecon to reconstruct the two slices at each rotation center. Gridrec reconstructs 2 sinograms at once, one in the real part and one in the imaginary part of a complex number, using the same center. So it is just as fast to reconstruct the top and bottom slices at the same time.
Computes the entropy of each reconstructed slice
Returns an 2-D array of entropy containing the entropy for each center for each of the 2 slices.
Finds the minimum entropy position (best center) for each slice
Plots entropy of each slice as a function of center position. Shifts the entropy for the second slice so the minimum is at the same entropy as the first slice to make the plot easier to visualize.
Reconstructs the top slice using the optimal center position found.
Writes an 8-bit scaled version of the reconstructed slice to a png file so it can be viewed here.
This is the output of the program, the plot of the entropy, and the reconstructed image when the above program is run:
IDL> .run compute_center_entropy
Reading TIFF slices ...
Initializing tomo_params ...
Optimizing rotation center ...
tomo_recon: time to convert to float:   7.0095062e-05
                 time to reconstruct:       13.976023
                          total time:       13.976093
optimize_rotation_center, time=       27.187029
Determining entropy minima ...
Center for slice 120:      961.500
Center for slice 1080:      925.500
Plotting results ...
tomo_recon: time to convert to float:   1.4066696e-05
                 time to reconstruct:      0.42197394
                          total time:      0.42198801
To my surprise this plot shows a noisy entropy and no clear minima, which is very different from the plot in the first post in this issue. The top center is 961.5 which is not too far from the correct value of 962.5, but the bottom center is far off. I figured out that the difference was my original post was using the "hann" filter in Gridrec, rather than the "shepp" filter. I thus changed the above program to use 'hann':
tp = tomo_params_init(vol, airPixels=0, ringWidth=0, gr_filtername='hann', paddedSinogramWidth=num_pixels, paddingaverage=0, sinoScale=1., reconScale=1.)
and ran the program again. This was the result:
IDL> .run compute_center_entropy
Reading TIFF slices ...
Initializing tomo_params ...
Optimizing rotation center ...
tomo_recon: time to convert to float:   4.3869019e-05
                 time to reconstruct:       14.081919
                          total time:       14.081963
optimize_rotation_center, time=       27.825037
Determining entropy minima ...
Center for slice 120:      962.500
Center for slice 1080:      962.500
Plotting results ...
tomo_recon: time to convert to float:   1.5020370e-05
                 time to reconstruct:      0.42539501
                          total time:      0.42541003
Now the entropy has a beautiful smooth shape with a clear minimum. The centers of both slices are at 962.5
The "hann" filter does some smoothing/noise reduction compared to the "shepp" filter. I then went back to the 'shepp' filter, but before reconstruction I smoothed the sinogram with a 2x2 boxcar filter by uncommenting these 2 lines in the program above:
slice120 = smooth(slice120,2)
slice1080 = smooth(slice1080,2)
This is the result:
IDL> .run compute_center_entropy
Reading TIFF slices ...
Initializing tomo_params ...
Optimizing rotation center ...
tomo_recon: time to convert to float:   4.4107437e-05
                 time to reconstruct:       13.967693
                          total time:       13.967737
optimize_rotation_center, time=       27.139068
Determining entropy minima ...
Center for slice 120:      962.500
Center for slice 1080:      962.500
Plotting results ...
tomo_recon: time to convert to float:   1.8119812e-05
                 time to reconstruct:      0.43086505
                          total time:      0.43088317
The result is nearly identical to using the 'hann' filter. So in order to get a good entropy minimization for centering it is necessary, at least with this rather noisy dataset, to either use the 'hann' filter or to do some smoothing on the slices before reconstruction.
I then disabled the smoothing and changed the tomo_params to use the values we typically use when reconstructing:
airPixels=10 to do secondary normalization to air on both sides of the sinogram
gr_filtername='hann'
paddedSinogramWidth=2048 to pad the sinogram to next biggest power of 2.
paddingaverage=10 to average the last 10 pixels on each side when padding
tp = tomo_params_init(vol, airPixels=10, ringWidth=0, gr_filtername='hann', paddedSinogramWidth=2048, paddingaverage=10, sinoScale=1., reconScale=1.)
This is the result:
IDL> .run compute_center_entropy
Reading TIFF slices ...
Initializing tomo_params ...
Optimizing rotation center ...
tomo_recon: time to convert to float:   6.1035156e-05
                 time to reconstruct:       14.188906
                          total time:       14.188967
optimize_rotation_center, time=       27.390647
Determining entropy minima ...
Center for slice 120:      962.500
Center for slice 1080:      962.500
Plotting results ...
tomo_recon: time to convert to float:   2.5033951e-05
                 time to reconstruct:      0.42528915
                          total time:      0.42531419
The result of the entropy minimization is very similar. However, now the reconstructed image is improved. In all of the previous reconstructions the edge of the aluminum cylinder containing the sample has a bright edge. This is is a reconstruction artifact caused by the fact that the cylinder was slightly larger than the field of view. By doing the secondary normalization to air this artifact is removed. Note however, that this artifact did not appear to interfere with the entropy minimization.
—
You are receiving this because you were mentioned.
Reply to this email directly, view it on GitHub, or unsubscribe.
|
|
@MarkRivers @decarlof Sorry this will be so long: I have often had trouble finding centers for XRF sinograms. I figured this was just sort of marginal data with XRF-specific self-absorption, but the discussion here prompted me to look at the automated centering too. What I find (for a 660 x values 720 angles over 360 degree XRF dataset at https://millenia.cars.aps.anl.gov/gsecars/data/Newville/tomo_slice.npz is consistent with what we normally see: the centering is often OK but needs tweaking by as much as 10 pixels. By eye for this data, the center is around 330 pixels, which gives a reconstruction
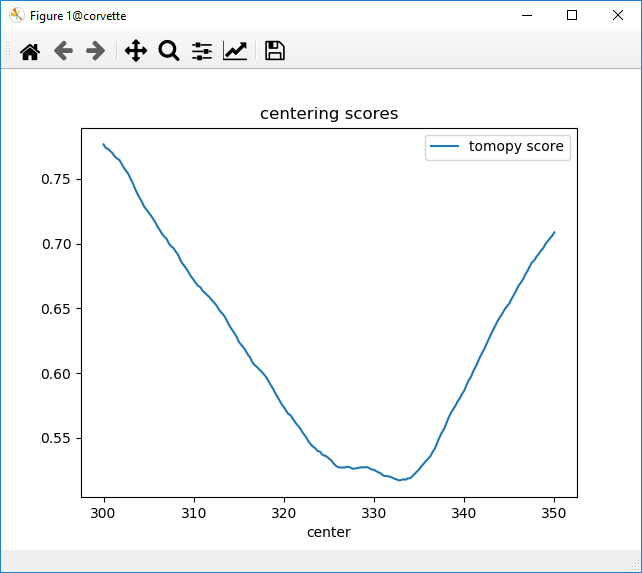
Following but trying to simplify the tomopy code, I have this: this gives
which doesn't seem too noisy, but is also several pixels away from Then I remembered that a while back I was playing with auto-focusing of microscope images, and found that using neg-entropy as the score to optimize was often problematic. I played with other methods then broke down and looked up some papers(!). It turns out that some nice studies had also shown neg-entropy to be only OK. The recommended score, especially when close to in-focus, was just "RMS image": ("make the bright spots bright and the dark spots dark"). Trying this for centering (and now rescaling the scores to go from 0 to 1) is just: which gives this:
which is pretty consistent with what I see for microscope images too: this Would it be worth adding to tomopy a centering method that combined the current neg-entropy score and this blurriness? I would suggest doing that as a two-element array to be minimized in the least-squares sense so that you didn't have to fuss with trying to automatically scale the two scores. If this is potentially useful, I'd be willing to make a PR for it. Is there a sufficient suite of test data to be able to run some benchmarks to decide which centering method should be the default? |


|
@newville I get mixed results:
in case of regular (good absorption and signal) well centered samples, I get: I have a large collection of both types with a sort of ground truth for the center (after vo auto-centering the user confirmed by inspection and tweaked when necessary, which is for vo less than 10% of the time on the first class of samples and almost never in the second class) so I will run the centering on all to see how much each method depends from the sample. For the code, I am using a slightly modified version of yours (here) where I basically included the exact code that is in tomopy + added per @MarkRivers suggestion |


|
@decarlof Interesting -- thanks. I found for our limited XRF tomo data that finding the center first with neg-entropy then with blurriness worked pretty well. I wasn't sure whether this had been tried with other CMT datasets. |
|
I have done a comparison of entopy calculations with tomopy and IDL with the dataset from @newville. This is the Python code, very similar to Matt's but writing out a TIFF file with the reconstruction at center=330. For some reason the tomopy reconstructions are rotated by 270 degrees compared to the IDL reconstructions, so I use rot90 so the TIFF files read into ImageJ are the same orientation. I also scaled both the IDL and tomopy images by 1e6 before writing to TIFF, because ImageJ GUIs don't handle very small numbers so well. This is the IDL code. It does the same thing as the Python code using the Gridrec/tomoRecon library called from IDL. This is the entropy plot with tomopy, which is the same as Matt's first plot:
This is the entropy plot with IDL:
They are somewhat similar, but IDL has a pronounced double minimum, with a local maximum at the correct rotation center of 330. Note that this dataset suffers from artifacts because the sample was actually too absorbing so there are pronounced streaks in the image in the directions where the beam traversed more than one highly absorbing particle. This is the tomopy reconstruction from the TIFF file, displayed in ImageJ over the gray scale range -500 to +1000.
This is the IDL reconstruction from the TIFF file, displayed in ImageJ over the gray scale range -500 to +1000.
The two images look very similar, it is very difficult to see any differences by eye. This is the difference of the two images, tomopy minus IDL.
So there are actually significant differences between the reconstructions, both inside the sample area, and outside of it. This is a measurement of the statistics in a 50x50 region located at 0,0, i.e. in the upper left corner of each image.
The first line is the tomopy reconstruction, the second line is the IDL reconstruction. Note that the tomopy reconstruction has significantly more noise: the standard deviation, min, and max are all nearly twice as large as the IDL reconstruction. The differences in the entropy calculation are due to these differences in the reconstructions. Why do we have these differences when we are nominally using the same Gridrec code? |


|
@decarlof wrote:
@decarlof could you make available 32-bit float TIFF files for normalized data for a couple of slices from each of those datasets? I would be interested to compare IDL entropy with tomopy entropy on those. |
@MarkRivers, TomoPy gridrec has been adjusted for performance reasons (to use faster libraries and compiler features) a few times over the years, so IMO it's very likely that the behavior was unintentionally changed. If you have a thorough understanding of the gridrec algorithm, I would be very grateful if you could check the source code for deviations from the original. |
@carterbox I will be happy to do that. I want to switch to using tomopy, but need to figure out why the reconstructions are almost 2X noisier than we have been getting with IDL. Hopefully it is just some setting that can be changed. In order to track it down I need to be able to build the development version of tomopy, rather than using the conda pre-built distribution. When I try to do that on my Centos 7 system I get the following errors: The error appears to be that I need a newer version of cmake. Are there instructions somewhere on how to set up a system to build tomopy? |
|
We have a development guide that is helpful (hopefully). Everything should "just work" if you set up a conda environment using one of our provided environment yamls. |
|
My apologies, I just discovered I had missed the step of setting up the tomopy environment and activating it. Now the build seems to have worked fine! |
|
I am going to open a new issue on the tomopy implementation of gridrec. That is independent of the centering issue. |
@MarkRivers normalized sino are here, these are 10 per datasets around the center. The readme file has the list of vo and manual centers. |
I am trying to copy those files with Globus. It fails every time with this error in the Globus event log:
|
|
@MarkRivers I shared this folder with Globus user: Mark Rivers (rivers@anl.gov). Did you perhaps log in into Globus with different credentials? |
|
@MarkRivers I found another set of credentials (rivers@cars.uchicago.edu) I just shared folder to these one. Please try again |
|
@MarkRivers, just a small observation. Maybe I am wrong. I see in both your provided tests in IDL and tomopy you use the Shep logan filter. It is defined differently in these two packages: Tomopy: IDL: The Shepp-Logan as it is defined in IDL kills more high frequencies than the one in tomopy, thus the results are less noisy. To my opinion, the Shepp-Logan filter in IDL is defined incorrectly (x is missing in the denominator?). Could you please verify that? Also for the center searching I would use other filters that really kill high frequencies: hann, hamm, parzen.. |
|
I'm not sure I agree. This is the tomopy definition: return fabsf(2 * x) * (sinf(M_PI * x) / (M_PI * x)); If you look at this expression carefully you will see that the first "x" and the last "x" cancel, because one is in the numerator and the other is in the denominator, assuming X is always non-negative. This then becomes: return fabsf(2) * (sinf(M_PI * x) / (M_PI)); This now differs from the IDL definition only by a factor of +-2, not by "x". So I don't think it is changing high frequency content. With IDL I do normally use the "hann" filter when centering. However, I tried that with tomopy and it also gave very different results from IDL. |
|
Is |
|
@MarkRivers, @newville if you look at all filter functions in IDL and in tomopy: Tomopy: In tomopy pars[0]=0.5 by default, and range for x is [0,0.5]. What is the range for x in IDL? For consistency with tomopy hann, hamming.. filters it should be in [0,1]. But then the shepp-logan is not consistent for both versions. |
Just for the record, the problem was not the credentials. The problem was that @decarlof computer was on an APS beamline network, and my computer was on an APS CAT network. APS networking had an ACL in place between those networks that blocked Globus. They modified the ACL and now it works. |
I have been using reconstruction software written in IDL at APS beamline 13-BM-D. It uses gridrec (tomoRecon) written in C++ at its core, but uses IDL as the user interface and programming language.
I want to switch to using tomopy. I am comparing results and performance between IDL and tomopy, and I am having problems with entropy based centering. The problem may just be that I don't understand how to use it in tomopy.
For IDL I first did the centering with the following configuration:
• Sinogram padding to 2048 (X size of projections is 1920)
• 10 pixel average of air pixels
• No ring artifact removal
This is a screen shot of the configuration screen. Note that Air pixels=10, Ring smoothing width=0, Padded Sinogram Width=2048.
This is a screen shot of the main IDL screen. In the Reconstruct section I have set Optimize method=Entropy, the initial guess of the rotation center=960, Optimize range=30 (+- 15 pixels), and the Optimize step=0.25 pixels. This will reconstruct the upper and lower slices at 120 different centers (30 pixels at 0.25 pixel step). I have selected an upper slice=120 and a lower slice=1080 to do the centering.
When I press optimize center I get this plot of the entropy as a function of rotation center. One plot is for the upper slice, the other for the lower slice. These curves show that the entropy is an extremely smooth function of rotation center, with single very well-defined minimum.
This is the main screen after optimization. Notice that the rotation center for both the upper and lower slices is 962.50. Thus, within the step size of 0.25 pixels the rotation center is the same for slices 120 and 1080. This means that the rotation axis is very well aligned with the columns of the camera.
I changed my initial guess of the center from 960 to 970. That resulted in this plot.
The minima were found in the identical location, 962.5.
I repeated the optimization again, but starting with an initial guess of 950. That also resulted in exactly the same center for both slices, 962.5
I optimized over a range of 30 pixels for this example. That required 26.7 seconds total to optimize both slices. In practice it is usually sufficient to optimize over a range of 10 pixels, since the rotation axis typically does not change during an experiment by more than +-5 pixels. Optimizing over a 10 pixel range takes 8.9 seconds.
In IDL I can also find the center using the 0 and 180 views and subtracting the images.
This is the setup for that. Note that Optimize center method=0-180 and the Optimize step is 0.5, which is the maximum resolution for this method.
This is the resulting plot. Note that the Y axis label is incorrect, it is not entropy it is the difference between the 0 and flipped 180 image as a function of the shift in one image.
This technique found the center at 963.0, within the 0.5 pixel step size of the value found by the entropy method.
Optimizing the center using tomopy
I used this Python program to test finding the centers with tomopy. It is intended to do the same steps as IDL above.
I have attached the program here as a .txt file.
test_center.py.txt
This is the output when running that program on the same dataset processed with IDL above. It's dimensions are NX=1920, NY=1200, NProjections=900. I have deleted some of the logging.info output from
tomopy.find_center()to save space.Conclusions
Using the 0-180 algorithm in tomopy gives the top and bottom centers as 962.25, which is within 0.25 pixels of the values obtained with the entropy method in IDL (962.5).
However, the following table shows that the centers determined with the entropy method in tomopy are highly scattered, and depend greatly on the initial guess.
Am I doing something wrong? Why are the tomopy centers using entropy so wrong, and highly dependent on the initial guess?
The text was updated successfully, but these errors were encountered: