- Themes
- Internationalization
- Prefs
- SVGs
- ContextMenus
- Flow
- Logging
- Testing
- Linting
- Performance
- Colors
- Configs
- Workers
- Telemetry
- Contributing to other packages
- Errors
- Getting Help
The local debugger supports two themes:
| Light | Dark |
|---|---|
 |
 |
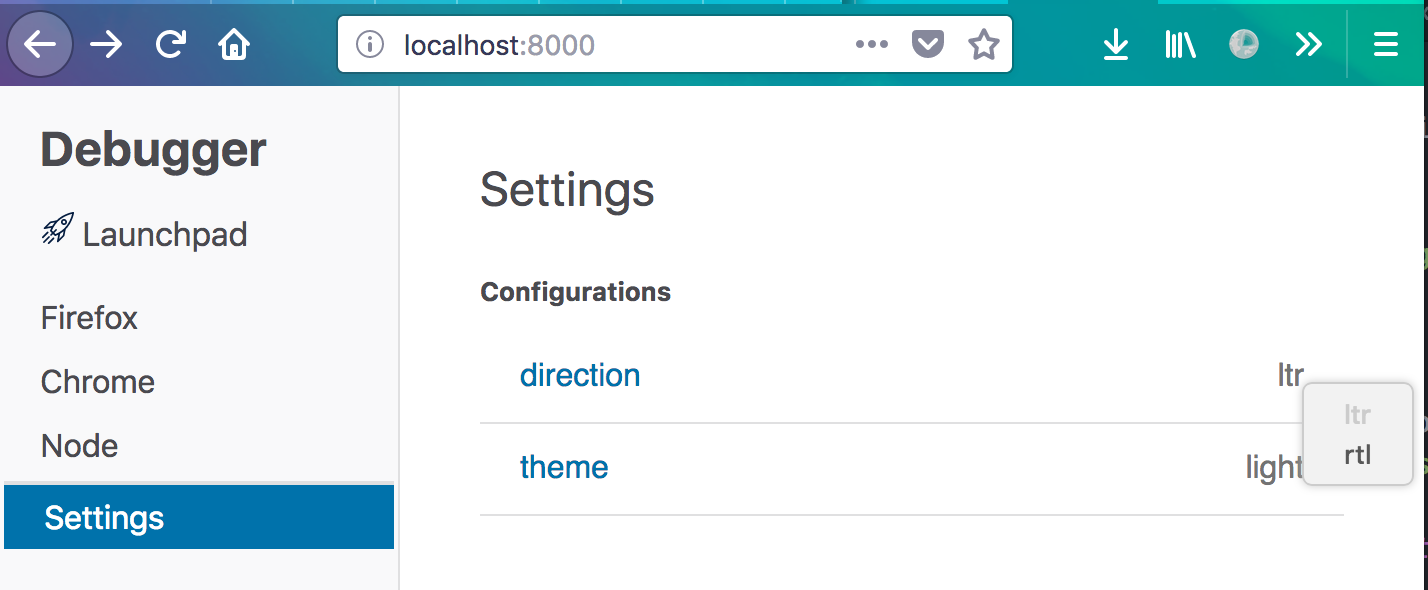
You can change the theme by going to the Settings panel in the launchpad and changing the theme to either light or dark.
It is possible to add a theme specific selector. For example, this selector updates the dark debugger button colors:
.theme-dark .command-bar > span {
  fill: var(--theme-body-color);
}We use variable theme colors to standardize the colors inside of devtools. A good way to find a color is to select another component with the inspector and see what color it uses. The colors can be found here.
The Debugger supports two types of internationalization RTL (right to left) layout and L10N (localization).
L10N is a global module with two methods getStr and getFormatStr. The docs include best practices for naming keys, localization notes, and other useful topics.
L10N.getStr("scopes.header");
L10N.getFormatStr("editor.searchResults", index + 1, count);
Translated strings are added to the debugger properties file.
RTL stands for right to left and is an important feature for arabic languages and hebrew. Here's what the debugger looks like right to left screenshot.
How do I set the Debugger to right to left?
Set the dir field in the Launchpad's settings pane.
How do I change how something looks in rtl?
We use logical CSS properties. For instance, if you need to add some padding-left in left-to-right layout and padding-right in right-to-left layout:
.my-component {
  padding-inline-start: 10px;
}User preferences are stored in Prefs. Prefs uses localStorage locally and firefox's profiles in the panel.
The two relevant files to look at are:
[assets/panel/prefs.js](https://github.com/firefox-devtools/debugger/blob/master/assets/panel/prefs.js)[src/utils/prefs.js](https://github.com/firefox-devtools/debugger/blob/master/src/utils/prefs.js)
Setting a default value
pref("devtools.debugger.pause-on-exceptions", true);Adding a pref
const prefs = new PrefsHelper("devtools", {
  clientSourceMapsEnabled: ["Bool", "debugger.pause-on-exceptions"]
});
Reading a pref
const { prefs } = require("./utils/prefs");
console.log(prefs.clientSourceMapsEnabled);
Setting a pref
const { prefs } = require("./utils/prefs");
prefs.clientSourceMapsEnabled = false;When you're starting a new feature, it's always good to ask yourself if the feature should be added behind a feature flag.
- does this feature need testing or introduce risk?
- will this feature be built over several PRs?
- is it possible we'll want to turn it off quickly?
It's easy to add a new feature flag to the project.
- add the flag to
assets/panel/prefs.jsandutils/prefs.js - import
features
Here's an example of adding a new feature "awesome sauce" to the Debugger:
diff --git a/assets/panel/prefs.js b/assets/panel/prefs.js
index 1cfe2da..7e3068f 100644
--- a/assets/panel/prefs.js
+++ b/assets/panel/prefs.js
@@ -44,3 +44,4 @@ pref("devtools.debugger.file-search-regex-match", false);
 pref("devtools.debugger.features.async-stepping", true);
 pref("devtools.debugger.features.project-text-search", true);
 pref("devtools.debugger.features.wasm", true);
+pref("devtools.debugger.features.awesome", false);
diff --git a/src/utils/prefs.js b/src/utils/prefs.js
index 429d56c..dadb36c 100644
--- a/src/utils/prefs.js
+++ b/src/utils/prefs.js
@@ -28,6 +28,7 @@ if (isDevelopment()) {
   pref("devtools.debugger.features.async-stepping", true);
   pref("devtools.debugger.features.wasm", true);
   pref("devtools.debugger.features.shortcuts", true);
+  pref("devtools.debugger.features.awesome", true);
 }

 export const prefs = new PrefsHelper("devtools", {
@@ -54,6 +55,7 @@ export const features = new PrefsHelper("devtools.debugger.features", {
   projectTextSearch: ["Bool", "project-text-search", true],
   wasm: ["Bool", "wasm", true],
   shortcuts: ["Bool", "shortcuts", false]
+  awesome: ["Bool", "awesome", false]
 });

 if (prefs.debuggerPrefsSchemaVersion !== prefsSchemaVersion) {

diff --git a/src/components/SecondaryPanes/index.js b/src/components/SecondaryPanes/index.js
index a390df2..c610c1a 100644
--- a/src/components/SecondaryPanes/index.js
+++ b/src/components/SecondaryPanes/index.js
@@ -127,6 +127,10 @@ class SecondaryPanes extends Component<Props> {
   getScopeItem() {
     const isPaused = () => !!this.props.pauseData;

+    if (features.aweseome) {
+      return <div>The Best</div>;
+    }
+We use SVGs in DevTools because they look good at any resolution.
Adding a new SVG
- add the SVG in /images](../images)
- add it to Svg.js
diff --git a/images/Svg.js b/images/Svg.js
index 775aecf..6a7c19d 100644
--- a/images/Svg.js
+++ b/images/Svg.js
@@ -24,7 +24,8 @@ const svg = {
   "subSettings": require("./subSettings.svg"),
   "toggleBreakpoints": require("./toggle-breakpoints.svg"),
   "worker": require("./worker.svg"),
-  "sad-face": require("./sad-face.svg")
+  "sad-face": require("./sad-face.svg"),
+  "happy-face": require("./happy-face.svg")
 };
Using an SVG
- import the
Svgmodule - call
Svg(<your-svg>)
diff --git a/src/components/Breakpoints.js b/src/components/Breakpoints.js
index 8c79f4d..6893673 100644
--- a/src/components/Breakpoints.js
+++ b/src/components/Breakpoints.js
@@ -4,6 +4,7 @@ const { bindActionCreators } = require("redux");
 const ImPropTypes = require("react-immutable-proptypes");
 const classnames = require("classnames");
 const actions = require("../actions");
+const Svg = require("./shared/Svg");
 const { getSource, getPause, getBreakpoints } = require("../selectors");
 const { makeLocationId } = require("../reducers/breakpoints");
@@ -89,6 +90,7 @@ const Breakpoints = React.createClass({
         key: locationId,
         onClick: () => this.selectBreakpoint(breakpoint)
       },
+      Svg("happy-face"),
       dom.input({
         type: "checkbox",
         className: "breakpoint-checkbox",
Styling an SVG element
You can style several SVG elements (svg, i, path) just as you would other elements.
- fill is especially useful for changing the color
diff --git a/src/components/Breakpoints.css b/src/components/Breakpoints.css
index 5996700..bb828d8 100644
--- a/src/components/Breakpoints.css
+++ b/src/components/Breakpoints.css
@@ -69,3 +69,11 @@
 .breakpoint:hover .close {
   display: block;
 }
+
+.breakpoint svg {
+  width: 16px;
+  position: absolute;
+  top: 12px;
+  left: 10px;
+  fill: var(--theme-graphs-full-red);
+}The Debugger can create its own context menus. In the launchpad, it uses a shimmed context menu library. In Firefox, it has special permission to create native context menus.
Here's a simple example:
const { showMenu } = require("devtools-launchpad");

function onClick(event) {
  const copySourceUri2Label = L10N.getStr("copySourceUri2");
  const copySourceUri2Key = L10N.getStr("copySourceUri2.accesskey");

  showMenu(event, [
    {
      id: "node-menu-copy-source",
      label: copySourceUri2Label,
      accesskey: copySourceUri2Key,
      disabled: false,
      click: () => copyToClipboad(url),
      hidden: () => url.match(/chrome:\/\//)
    }
  ]);
}
Notes:
idhelps screen readers and accessibilitylabelmenu item label shownaccesskeykeyboard shortcut useddisabledinert itemclickon click callbackhiddendynamically hide items
Access Keys are keyboard shortcuts for an item in the context menu and are only used when the context menu is open. They are an accessibility feature. Access keys take precedence over all other keyboard shortcuts when the context menu is open except for CodeMirror shortcuts. Access Keys are defined in the properties file next to the menu item's string. You can use any key that is not already added, but try to use your own discretion about which key makes the most sense
# LOCALIZATION NOTE (copySourceUri2): This is the text that appears in the
# context menu to copy the source URL of file open.
copySourceUri2=Copy Source Url

# LOCALIZATION NOTE (copySourceUri2.accesskey): Access key to copy the source URL of a file from
# the context menu.
copySourceUri2.accesskey=u
You can use a menu item separator to create menu groups.
const { showMenu } = require("devtools-launchpad");

function onClick(event) {
  const copySourceUri2Label = L10N.getStr("copySourceUri2");
  const copySourceUri2Key = L10N.getStr("copySourceUri2.accesskey");

  const menuItem = {
    id: "node-menu-copy-source",
    label: copySourceUri2Label,
    accesskey: copySourceUri2Key,
    disabled: false,
    click: () => copyToClipboad(url),
    hidden: () => url.match(/chrome:\/\//)
  };

  showMenu(event, [menuItem, { item: { type: "separator" } }]);
}- Adding flow to a file
- Running flow
- Missing Annotation
- Where are types defined?
- Checking flow coverage
- Common Errors
Our reducers are where we store the debugger state. We try to follow Redux best practices, but have added our own flavor as well with the help of Flow and Immutable
We type our stores so that we can document the shape of the data and guarantee the data coming in and out is well formed.
Let's look at the expressions reducer and see how it is typed:
type ExpressionState = {
  expressions: List<Expression>
};

export const createExpressionState = makeRecord(
  ({
    expressions: List()
  }: ExpressionState)
);

function update(
  state: Record<ExpressionState> = createExpressionState(),
  action: Action
): Record<ExpressionState> {
  // ...
}

type OuterState = { expressions: Record<ExpressionState> };

export function getExpressions(state: OuterState, input: string) {
  return getExpressions(state).find(exp => exp.input == input);
}
The ExpressionState documents the reducers fields. We use it in three places:
State- an Immutable expression state recordupdate- the reducer function which receives the expression state recordOuterState- a local type representing the application state passed into selectors
We try to wrap our state in Immutable records when we can for two reasons. First it means that the state can only be modified in the reducers. Second, it helps our connected components avoid unnecessary renders.
Connect will trigger a re-render when it sees new state, even if it has not changed. Immutable, will creates new objects if and only if the data changes, which means our components only render when it's appropriate.
The one situation where we do not use immutable is when it is too slow to do so. We avoid wrapping our pause state in immutable, because it takes too long to serialize the data.
Let's take a look at the Expressions reducer to see how we use Immutable.
type ExpressionState = {
  expressions: List<Expression>
};

export const createExpressionState = makeRecord(
  ({
    expressions: List()
  }: ExpressionState)
);

function update(
  state: Record<ExpressionState> = createExpressionState(),
  action: Action
): Record<ExpressionState> {
  case "DELETE_EXPRESSION":
    return deleteExpression(state, action.input);
  // ...
}

type OuterState = { expressions: Record<ExpressionState> };

function deleteExpression(state: State, input: string) {
  const index = getExpressions({ expressions: state }).findKey(
    e => e.input == input
  );
  return state.deleteIn(["expressions", index]);
}
The first thing to notice is that the expression is an Immutable list.
We document that here List<Expression> and here expressions: List().
The second thing to note is that we use the Immutable api to update the state.
We do that in deleteExpression here state.deleteIn. There docs are really helpful.
The third item is Immutable Records. Records are a special type of Immutable Map, that act like named structs.
We use them when defining our reducer states, but they can be used more broadly as well.
We define the State record above with makeRecord, which wraps Immutable Record so that we can
tell Flow that we're creating an Expression State record.
Logging information can be very useful when developing, and there are a few logging options available to you.
To enable logging:
- Create a local config file if you don't already have one
- Edit your local config, changing the value of the logger type you want to see to
true
  "logging": {
    "client": false,
    "firefoxProxy": false,
    "actions": true
}- Restart your development server by typing ctrl+c in the Terminal and run
yarn startagain
Let's cover the logging types.
-
client - This option is currently unused.
-
firefoxProxy - This logger outputs a verbose output of all the Firefox protocol packets to your shell.
-
actions - This logger outputs the Redux actions fired to the browser console.
Your code must pass all tests to be merged in. Your tests should pass locally before you create a PR and the CI should run an automated test that also passes.
Here's how you can run all the unit tests, lints, and integration tests at once:
yarn run test:allyarn testorjest- runs the jest unit testsjest -u- will update the jest fixturesjest --watch- will run the tests every time a file changes
There are two styles of component tests: interaction, snapshot.
We shallow render the component and simulate an UI interaction like click.
it("should call handleClick function", () => {
  const onClick = jest.fn();
  const wrapper = shallow(new CloseButton({ handleClick: onClick }));

  wrapper.simulate("click");
  expect(onClick).toBeCalled();
});We shallow render the component to a JSON and save it to a fixture. Subsequent runs are compared to the fixture.
it("should render a button", () => {
  const onClick = jest.fn();
  const buttonClass = "class";
  const wrapper = shallow(
    new CloseButton({
      handleClick: onClick,
      buttonClass: buttonClass,
      tooltip: "Close button"
    })
  );

  expect(wrapper).toMatchSnapshot();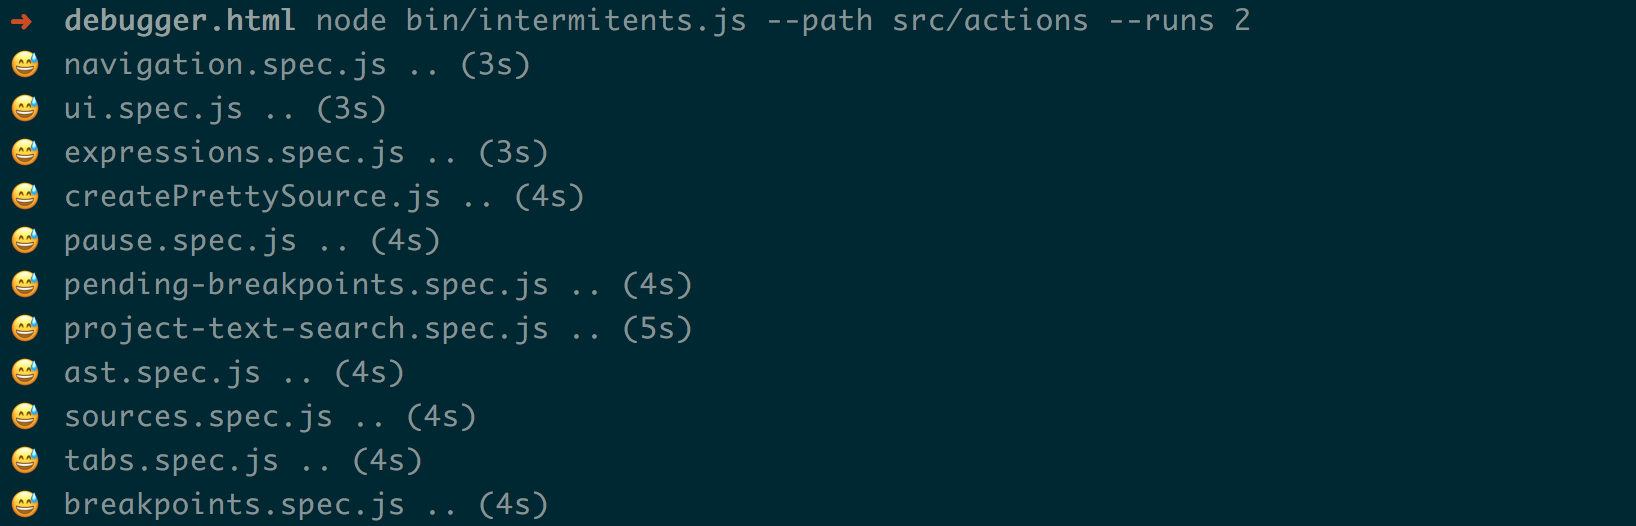
});When CI is showing a jest intermittent, it's usually possible to reproduce it locally.
The intermittents script will run tests several times until you find the failing suite.
node bin/intermittents # run all of the tests 10 times
node bin/intermittents --path src/actions
node bin/intermittents --path src/actions/tests/pending-breakpoints --runs 50
node bin/intermittents --group # will run the tests in groups
``
When you find a file that has an intermittent, it sometimes helps to focus on a single test
with the `jest --watch` test filter command.
When you have a test that is flakey, you can look at the code and try and find the problem.
90% of the time it will be an asynchronous call we don\'t wait for. Here is a recent fix.
Notice that `sourceMaps.generatedToOriginalId` was asynchronous, but we didn't wait for it.
```diff
diff --git a/src/actions/sources/createPrettySource.js b/src/actions/sources/createPrettySource.js
index a3b2ba6..cd5a8e7 100644
--- a/src/actions/sources/createPrettySource.js
+++ b/src/actions/sources/createPrettySource.js
@@ -7,7 +7,7 @@ export function createPrettySource(sourceId) {
return async ({ dispatch, getState, sourceMaps }) => {
const source = getSource(getState(), sourceId).toJS();
const url = getPrettySourceURL(source.url);
- const id = sourceMaps.generatedToOriginalId(sourceId, url);
+ const id = await sourceMaps.generatedToOriginalId(sourceId, url);| Type | Command |
|---|---|
| all | yarn run lint |
| css | yarn run lint:css |
| js | yarn run lint:js |
| markdown | yarn run lint:md |
| a11y | yarn run lint:jsx-a11y |
We use Stylelint to maintain our CSS styles. The .stylelintrc file contains the style definitions, please adhere to those styles when making changes.
To test your CSS changes run the command:
yarn run lint:cssWe use eslint to maintain our JavaScript styles. The .eslintrc file contains our style definitions, please adhere to those styles when making changes.
To automatically fix many errors run the command:
yarn run lint:jsWe use remark to help lint our markdown. It checks for broken images, links, and a set of style rules.
The Debugger has a styleguide that we use to keep the colors consistent across tools and themes.
The common colors are represented as css variables in a devtools variables file. This lets define the colors for each theme: light, dark.
Performance problems can be tricky to understand because they're silent. There are rarely error messages to start with. This performance outlines some good places to start digging.
Most color changes can be made by finding a different css variable.
For instance, --theme-splitter-color is often good for border colors. The advantage to using an existing variable is that you know it'll look good in all the themes.
When you need to update a variable, you should check to make sure it looks good in the other places it is being used. Often, it is more practical to create a new variable.
It's helpful to share the changes as a themes table when you're done.
It's important to make sure that the contrast ratio is sufficient.
You can check the background / text color contrast ratio with this tool.
The Debugger uses configs for settings like theme, hotReloading
The default development configs are in development-json. It's easy to change a setting in the Launchpad's settings tab or by updating your configs/local.json file.
The Debugger takes advantage of web workers to delegate work to other processes. Some examples of this are source maps, parsing, and search. In these cases, the debugger asks the worker to do potentially difficult work so that the main thread doesn't have to.
There are a couple of steps needed to make a function a worker task.
- add a task to the worker index e.g. (
dispatcher.task("getMatches")) - add the function to the worker handler
workerHandler({ getMatches })
Here's the full example.
diff --git a/src/utils/search/index.js b/src/utils/search/index.js
index 2ec930c..fcb55bb 100644
--- a/src/utils/search/index.js
+++ b/src/utils/search/index.js
@@ -6,3 +6,4 @@ export const startSearchWorker = dispatcher.start.bind(dispatcher);
 export const stopSearchWorker = dispatcher.stop.bind(dispatcher);

 export const countMatches = dispatcher.task("countMatches");
+export const getMatches = dispatcher.task("getMatches");
diff --git a/src/utils/search/worker.js b/src/utils/search/worker.js
index dbba6c1..75f7b2c 100644
--- a/src/utils/search/worker.js
+++ b/src/utils/search/worker.js
@@ -1,4 +1,6 @@
 import buildQuery from "./utils/build-query";
+import getMatches from "./getMatches";
+
 import { workerUtils } from "devtools-utils";
 const { workerHandler } = workerUtils;

@@ -14,4 +16,4 @@ export function countMatches(
   return match ? match.length : 0;
 }

-self.onmessage = workerHandler({ countMatches });
+self.onmessage = workerHandler({ countMatches, getMatches });
Telemetry is the Mozilla system for gathering usage metrics. The Telemetry documentation has in depth information, as well as a walk through of how to create new telemetry probes.
There are two mechanisms available: Scalars, Histograms. Histograms are older, and Scalars is the new preferred method. However Scalars cannot do everything, so both are used.
- Scalars: Count of an event
- Histograms: Distribution of an event
const Telemetry = require("devtools-modules/src/utils/telemetry");
const telemetry = new Telemetry();
const loadSourceHistogram = "DEVTOOLS_DEBUGGER_LOAD_SOURCE_MS";
telemetry.start(loadSourceHistogram, this);
const Telemetry = require("devtools-modules/src/utils/telemetry");
const telemetry = new Telemetry();
telemetry.scalarAdd("devtools.debugger.source_selected", 1);We also need to add probe definitions, to the histograms.json and scalars.yaml, as it needs a bug number and the questionnaire (called request template) mentioned in the telemetry documentation. An example of this process is found in Bug 1429047
The debugger depends on several other devtools packages. Sometimes a debugger feature will necessitate working on one of these other packages. In these cases, you'll need to get the project and work on it directly.
| Launchpad | Development environment |
| Reps | Variable formatter |
| Client Adapters | Browser connection library |
| Modules | Shared modules |
| Source Maps | Library for working with source maps |
There are three ways to test a change to a 3rd party package.
- yarn link
- create a local version with npm pack and yarn add
- change the file directly in the debugger's
node_modulesdirectory.
If you're running into errors associated with updating your files locally, try:
git checkout .yarn nomgit pull --rebase
Another option is to reset your branch to master:
git fetch origingit checkout mastergit reset --hard origin/masteryarn nomto update node modulesyarn startto restart local server
There are lots of helpful folks who'd be happy to answer your questions on Slack.
| Component | 🐶 🐼 🐹 | |
|---|---|---|
| Editor |  |
 @jasonlaster @jasonlaster  @jbhoosreddy @jbhoosreddy |
| Sources |  |
 @arthur801031 @arthur801031  @bomsy @bomsy |
| Call Stack |  |
 @zacqary @zacqary  @wldcordeiro @wldcordeiro |
| Scopes & Variables |  |
@bomsy @arthur801031 |
| Breakpoints |  |
@wldcordeiro @jbhoosreddy |
| Product & UI |  @clarkbw @jasonlaster @clarkbw @jasonlaster |