Workshop materials and data visualization resources for the Introduction to Python for Data Visualization Workshop at Tulane University Howard-Tilton Memorial Library


Python package dependencies: numpy pandas jupyter matplotlib seaborn plotly. If you have installed Python through the Anaconda Python distribution then all of these packages will be installed except plotly. To install plotly run conda install package-name in your terminal.
The first half of the workshop, including the introduction to Python, as well as plotting using the matplotlib library, is primarily based on the Software Carpentries workshop: Plotting and Programming in Python. Please review lesson one (Running and Quitting) through lesson nine (Plotting) for a thorough review of the materials covered during the workshop.
For more background in developing foundational coding and data science skills please refer to other lessons available through the Software Carpentries: https://software-carpentry.org/lessons/

For a review of the second half of the workshop, on plotting in Python with the seaborn and plotly libraries review the Data Visualization in Python with Seaborn and Plotly Jupyter Notebook in this Github repository. You can also download the notebook for use on your own computer.
The Jupter Notebook is a an open-source, web-based application that can be run locally, or shared online, and allows you to create and share documents (notebooks) that contain live code, visualizations, narrative text, and mathematical equations. They provide a wonderful way of documenting and sharing your research with the world.
These notebooks are rendered natively in Github so you can share them with others. They can be managed under versioning control using Git, and shared on GitHub, a cloud-based hosting service that allows you to manage and share your Git repositories. For more information on versioning control and how to create a Git project and share it with the world follow the Software Carpentries tutorial on Version Control with Git and Github.
To see a list of keyboard shortcuts, in a running Jupyter notebook first enter command mode by hitting esc. Then press the h key to display the help menu, which will display common operations and their corresponding shortcuts. These shortcuts are operating system dependent, so if you call the h prompt from Windows your shortcuts will look different than if you call h from a Mac.
Jupyter is extensible, that is you can add extensions to it in order to enhance its functionality. One such extension is the RISE extension. RISE stands for Reveal.js -- Jupyter/IPython Slideshow Extension. This extension allows you to toggle between a normal notebook instance and an interactive presentation mode. The introduction to Data Visualization presentation at the beginning of the workshop was simply a Jupyter Notebook in RISE mode.

To install RISE run conda install -c conda-forge rise. You may notice some additonal commands then the normal conda install some-package. This is because the extension we want to install (RISE) is not an offical extension, but instead developed by the community. To install extensions developed by the community we need to specify the community built distribution channel conda-forge using the -c argument to indicate that we are using an alternative package channel. Once installed, to enable RISE mode while in a running Jupyter Notebook instance use the keyboard shortcut Alt-r.
The role of color in data visualization is profound. Choosing the right colors for your data visualization is essential. Some considerations for appropriate color choice include accessibility (ensuring colors are distinguishable, even to those with colorblindness), perceptual uniformity, and format (will the colors be differentiable even when printed in grayscale).
Stephen Few offers an excellent guide on for choosing colors for data visualizations: Practical Rules for Using Color in Charts
Arguably the most popular color palette generator is ColorBrewer. ColorBrewer allows for the creation of colorblind safe, print friendly safe, and photocopy safe color palettes so your data visualizations will be accessible and usable to your entire audience.

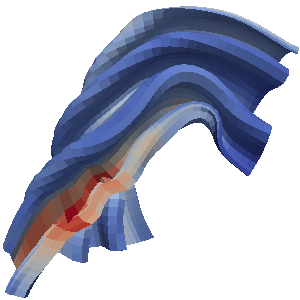
When working in scientific visualization, pseudocoloring 2D and 3D scalar fields, such as a topographical surface map, choice of color map is important. Color maps should change uniformly in brightness to indicate changes in value. The perceptual changes in commonly used color maps however, such as the rainbow color map ubiquitous in Matlab, do not abide by these rules. This leads to misleading interpretations of scientific figures.
Kenneth Moreland, PhD at Sandia National Laboratories, offers some useful advice on choosing the appropriate color map for your scientific visualization:
Color Map Advice for Scientific Visualization
This list is evolving, so check back to see if new resources have been added.
A library of data visualization types. Sometimes you just need inspiration: Data Viz Project
Duke University offers an excellent libguide on Data Visualization which contains a list of tools for data visualization, as well as taxonomy of visualization types.
The Visual Display of Quantitative Information - Edward Tufte The classic book on data visualization, sometimes polarizing and opinionated, but a classic nonetheless and worth reading.
Visualizing Data - William Cleveland A rigorous text on graphical methods for the display of statistical information. This book is a must read for any scientist attempting to effectively and accurately communicate data using visualizations.
