Use the VNA app for output power measurement not just Gain #772
Comments
|
Hello Peter, I'm glad that the VNA works well for you. I don't have any idea of how to measure the output power of an amplifier. Could you please provide more details about what exactly should be measured? I've just had a look at the following two documents: They both mention power sensors that convert power to DC voltage. Are you using something similar? Best regards, Pavel |
|
Just to clarify what I am measuring, it is actually not just the final stage (so a PA), but a pre-driver (MHW592), a driver (pushpull MRF134) and the final stage (pushpull VRF 151). So a whole amplifying chain. I use two of these power meter devices: This rf power meters are based on the famous AD8307 chip of Analogue Devices which is quite accurate between 0 and 60 Mhz. I verified that the rms voltage indicated by this rf power meter matches the one measured with the red-pitaya oscilloscope as well as my other "bitscope" oscilloscope. That's how I am confident that the power indication of these device is OK over a wide dynamic range as long as they are being used well below their 1dB compression point (so roughly around 10 dBm). The dynamic range of these AD8307 based devices is 70dB which is not bad at all. One of the two rf power meter is placed at the input of the amplifier and the other one at the output of the amplifier as I want to measure input and output and gain at the same time. I use adequate attenuators and power-bridges on the input and output of the amplifier:
This set-up allows to measure, the input power and the output power as well as the gain at the same time (by deducting the difference between the power indicated on the input and output rf power meters). Fortunately, the gain measured that way matches the one measured by the VNA, quite reasuring ;-) ;-). I do all the math in Excell to compensate for the power bridge and attenuator effects. I verify that the set-up and my Excell calculations is correct by measuring a reference attenuator. If the attenuation measured that way matches the attenuation measured with your VNA app, then my set-up is fine. I am amazed how similar the results obtained are, there is no more than +/- 0.1 dB differences between the two methods and most of the time there is no differences at all!!! I also used QUISK to double check that my output power measurement with the AD8307 device is OK. Again the trick is to ensure that the attenuator used is known and well specified and that attenuated measured signal is well below the 1dB compression point of the red-pitaya (in my case around -10dBFs it depends on the type of front-end used). It is then a matter of converting the dBFS readings into real dBm which is straightforward. Using this method I get nearly (+/- 2.5 %) the same output power reading (in W) than with the AD8307 method which is another proof that this AD8307 chip is not doing so bad The procedure is quite tedious because of the need to use Excell to do the math, the need to set manually the frequency of measurement on the two rf power meters (there is some frequency compensation build in the firmware of these devices, so settings must be changed manually for each frequency on each of the power meters). Ideally I would like to be able to measure the gain, and the corresponding input and output power at the same time with the VNA app all in one sweep (and not the gain only). I was thinking that maybe the "DUT tab" or a "new tab" could possibly indicate the power input and output power (in dBm ? or dBFs ?) as measured during gain-short sweeps ? Doing a "gain-short" sweep would then provide the gain (in dB) under the gain-short tab (as it is today) as well as input and output power (in dBm? or dBFS ?) under the modified DUT tab or a under new one. Of course, it would be nice if could be possible to enter the value of the attenuators used in the input of the amplifier (if any) and output of the amplifier so the results are directly exploitable. Example:
I have recently ordered these "Wide Frequency RF Envelope Detector Detection Module Board 0.1M-3.3GHz SMA" : but have not tested them yet. |
|
Thanks a lot for the details. I think that I'm starting to understand how the power measurement works. So, if I'm not mistaken, AD8307 is the power sensor and it converts RF power to DC voltage. Then the DC voltage should be measured with an ADC. The measurement process could look like the following:
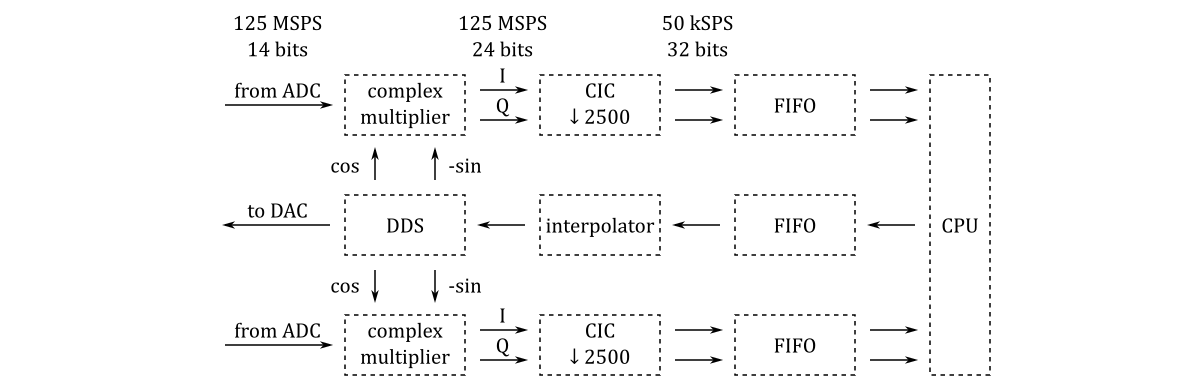
Is my understanding of the process correct so far? I don't think that the VNA application would work for this measurement process because the input ADC samples are multiplied by cos and -sin: I think that this kind of measurement requires a separate application. |
That is correct. It's a logarithmic detector by the way not a linear one. The conversion V /dBm is based on a conversion table provided by Analogue device.
Yes correct, the minimum requirement would be to measure the output power. Ideally both input and output voltages (so the gain also comes as an additional benefit). If attenuators are used in the input and output, it would be great to enter the value so the result displayed is the actual true input and output power (and gain)
But the DUT data is actually the raw output data ? it is not possible to derive a power indication from it ?
Unfortunately |
The DUT data is the ADC samples multiplied by cos and -sin, filtered and down-sampled by 2500.
I'd say that it's not possible but maybe I'm mistaken.
I'm nor sure why. The unmodified VNA application can't be used for the power measurements. Some modifications of the FPGA configuration and of the user interface are required. I think that it would be easier to create a new power measurement application with some parts borrowed from the VNA application than to try merging both applications into a single one. |
|
Actually this application would have to filter out all harmonics to ensure that during the sweep only the power of the target fundamental frequency is measured and that the power of its harmonics are not included in the measurement. That is why I also use the spectrum analyzer in the output path when I want to make accurate manual power measurements (the effect of harmonics is not negligible). As you can imagine the whole manual procedure, to measure accurately the output power of the entire HF band takes time and is quite tedious and it is easy to make some errors. A simple app (with the input and output attenuator as GUI parameter) that would in one single sweep report input power (in dBm), output power (ind dBm) and gain (in DB) (taking into account the value of input and output attenuators of course) would be fantastic and great time saver. If the app could also measure the the relative power (in dBc) of the second harmonic (for input signals up to 30 Mhz I guess ) and of the third one (for input signals up to 20 Mhz I guess) in separate tabs it would also be a very useful. Finally, the Chery on the cake would be if this app could also generate a two tone test signals (TTT) (with the power of each two tone signal set exactly 6dB below the power of the input signal used for the power measurement when TTT is disabled) in order to measure the IMD3 in dBC ( third order inter modulation products) it would be close to a miracle. So that would make up a total of 6 tabs for the result of the sweep ; input power in dBm or dBFS, output power in dBm or dBFS , gain in dB, relative power of the 2nd harmonic in dBc, relative power of the 3rd harmonic in dBc and IMD3 in dBc. The user input parameters are ; start frequency, stop frequency, input attenuator value, output attenuator value and a button to toggle the two tone test signal in order to obtain IMD3 test results. Doing this would require a very clean input signal with very low harmonic content and some very good digital filters to measure the power of the fundamental signal as well as its 2nd and 3rd harmonics, and third order inter modulation products during TTT tests Not sure if I will ever succeed to program such an application as the learning curve will be quite steep for me, so if anyone is interested to program this please take the lead. All I can, say is that unless this type of tool is already available in the ham community and I don't know it, this could be quite a useful application that could bring a nice added value to any one wishing to accurately and efficiently characterize an amplifier between 0 and 60 Mhz using two good calibrated attenuators on the input and output of the amp. The only two elements of info missing in this app to get the complete picture of an amp under test would then be the measurement of the -1dB compression point (so how the gain changes/does not change for different input power) and maybe the noise figure too. |
I'm afraid that I don't understand this part. Here are my questions:
So, I don't understand what kind of power measurement are you looking to implement, narrowband or wideband. After reading the linked document, I have an impression that the true power measurements should be wideband. If the narrowband measurement is OK for you, then maybe the receiver-based amplitude measurement as described on page 18 in WTG_RefGuide_F1128_sm_web.pdf is the way to go. It can be done without any power sensors, logarithmic detectors, etc. Am I missing anything? |
|
Dear Pavel, Of course you are not missing anything. I am sorry if I was not clear enough. Just to avoid any confusions, please note that that I am measuring power of sine-waves (CW) not of modulated signals. That's an important point not to be missed in the discussion between narrow band and wide band power measurement methods. I made my first power measurements of the output of my homemade amplifier using "wide band power sensors" based on AD8307/8317 chips (that convert power into voltage), but I found the results of my measurements to be less accurate then when I used the redpitaya spectrum analyser. The spectrum analyser app allows to measure the power of the fundamental signals and of some of its harmonics which is something that the wide band power detector method is unable to do for obvious reasons (as you pointed out yourself and as described very well in the paper that you referred to). I am using both methods but my favourite one is clearly the narrow bandwidth one using a spectrum analyser. I find the use of the spectrum analyzer the most accurate method to characterize an rf amplifier when the input signal is a CW sine. I f my understanding is right, the paper you referred to reaches the same conclusion. My point is that the narrow bandwidth or wide bandwidth methods are slow, tedious and error prone and that it would be nice to have an app that automates it to be able to measure the performance of wideband HF amplifiers in a fast and easy way. My idea is to connect the redpitaya output 1 at the input if the amplifier via an input attenuator, connect the redpitaya input 1 at the output of the rf amplifier via an output attenuator, click on some button and get in return in one single frequency sweep all the info that I mentioned earlier (see the list in my previous post). Obviously to get info about the level of the second and third harmonics, and the IMD3 only the narrow bandwidth method based on some form of spectral analysis is relevant. At the moment I am doing all these repetitive measurements (narrow or wide bandwidth ones) at 2, 3, 4, 5, 7, 10, 14, 18, 21, 28, 30, 50 and 52 Mhz and believe me it takes me time and energy as everytime I want to change something in my rf amplifier to try to optimize it (for instance the output TLT, the bifillar choke, the gate source feedback network or simply the bias current), I have to repeat all my measurements to see the effect of the changes I introduced at different frequencies. If I had an app, to measure input power, output power, gain , level of 2nd and 3rd harmonics, IMD3, gain compression in one go between 0 and 60 Mhz, it would be much simpler to experiment with rf amplifiers, that is all I am saying. Thank you again for your great work Regards |
|
Have you found a solution? Otherwise, let's keep this issue open and continue to accumulate the information about power measurements. Once we have a clear understanding of how exactly this kind of measurements could be implemented on Red Pitaya, it'll be a very good starting point for a new project. |
|
Hello Pavel, No of course, no solution yet. I didn't find an app that would automate all these gain and power measurements. a) I have however tried a third method, the QUISK method. I use the QUISK and the HPSDR transceiver to measure the signal strength with the QUISK S meter (in dBFS) and then I convert dBFS into dBm. This would probably work well too with PowerSDR, my point is not to promote QUISK here. b) The dynamic range in this set up with the 50KSA sampling rate is quite good and exceeds the one of the AD8307 by far (thanks to the decimation). The reliable dynamic range of the AD8307 for accurate (+/- 0.5 dB) measurement is about 70dB according to the specifications and this is what I have observed as well during my experimentations. The dynamic range of the AD8307 is of course well inferior to the red pitaya QUISK/HPSDR set-up assuming a sampling rate of 50 KSA. Signal to noise ratio is simply better than with an AD8307 so inevitably the power measurement with the QUISK set up is more accurate as well. c) I am must say I am impressed with he quality of the QUISK S meter which seems very accurate and linear as long as the signal measured is far below the -1 dB commpression point and as long as the signal to noise ratio is good (so signal well above the noise floor and measured within an adequate bandwidth). So the trick I use to make reliable and accurate power measurement is to calibrate my measurements in dBFS based on the measurement of the AD8307 in dBm WITH SOME CLEAN REFERENCE SIGNALS (so with very low spurs and harmonic content, typically well below -40dBc). Once the "GAIN" (actually more the transfer function) of the QUISK/AD8307 set-up is known, it is possible to use QUISK to make accurate power measurements OF NOT SO CLEAN SIGNALS (typically the output of an amplifier) with the same if not better accuracy than the AD8307. The advantage of using the QUISK/AD8307 calibrated set-up over a single AD8307 are multiple; the better dynamic range, the possibility of measuring harmonics & spurs as well as the IMD3 (during a two tone test). These spectral measurements are not possible with the AD8307 only of course, but the AD8307 is useful to CALIBRATE QUISK readings based on some CLEAN REFERENCE SIGNALS. With this approach, I actually get the best of both worlds; the well known accuracy of the AD8307 with the better linearity, dynamic range and spectral inspection capabilities of the redpitaya/hpsdr/quisk set-up (cfr the paper you refered to which is very clear about that). By the way the AD8317 is not as good as the AD8307 for HF power measurement, it is designed principally for power measurement in the GHz range, the usable dynamic range is much lesser too (50dB) d) The same approach than QUISK/AD8307 set-up can be followed with the spectrum analyser app, but the approach is not as performing as with the QUISK set-up; The spectrum analyser app stops measuring peaks automatically above 50 Mhz (the famous out of range notification) . The spectrum analyser app also has a lesser dynamic range and has a lesser frequency resolution that prevent of measuring IMD3 of two tone test signals which are only distant by a few Khz. The only advantage of the spectrum analyzer app over the Quisk set-up is that it is possible to view the whole spectrum at once and check in a single glance all the harmonic. Whereas in the QUISK set-up that's not an option, each harmonic must be tuned at sperately to be measured (If you remember we had a discussion about the bandscope functionality of QUISK which is not available as the relevant part of the HPSDR protocol is not implemented). Ideally, for power measurement, you want the accuracy, frequency resolution and the dynamic range of a QUISK like set-up with some panoramic capabilities similar to a spectrum analyser like app. QSspectrum analyser in combination with the SDR transceiver is supposed to provide that, but from what I remember there are issues with the QSpectrum/SDR transceiver set-up that prevent from using this set-up for accurate power measurement based on some AD8307calibration (the scan must be slowed down significantly to avoid multiple detection peaks, there are also errors at some frequencies resulting from the "cropping"), QUISK and even the Spectrum analyser app works better in practice for power measurement. e) Again I think the key challenge is no so much to make "accurate" power measurements, but to succeed to automate all these power measurements as most of the time an experimenter does not wants to measure only the output power a fundamental signal at one single frequency, but also the power of the input signal, the gain of the DUT, the harmonics (and maybe also unwanted Aliases possibly unwillingly amplified) and not just for ONE frequency but for SEVERAL ONES. The goal should be for the experimenter to be able to focus as much as possible on what he wants to experiment (typically an amplifier) and not on the measurement sep-up. Using the quisk/hpsdr/redpitaya method with some manual calibration based on an AD8307 and some clean reference signals is really slow, cumbersome, tedious and prone to manual errors, but this is all I have today so it is better than nothing (to remain positive). Again PowerSDR would probably do the same, I am not trying to promote QUISK. f) one quick note about gain compression, this is also extremely useful to measure as well as it is linked to IMD3 and harmonics generation. So identifying how the gain reduces as the input power increases is very useful for the experimenter for testing / building amplifiers. The 80dB dynamic range of the redpitaya offers great possibilities in order to that but there is no app available to do it in an automated way at several frequencies. So an app that would be able to increase gradually by steps of 0.5 dB the power of the red pitaya output signal and to measure the gain variation of a DUT would be very useful as well if it can do that at SEVERAL frequencies (not just one) . At the moment I have to use an external attenuator PE4302 and an Arduino to be able to accurately control the output power of my red-pitaya by steps of 0.5 dB, no really convenient and not very rational/efficient at all considering the potential of the RP !!! I hate myself when I do that but I have no other possibilities.... Regards |
|
some starting ideas for high level specification of a new app ideas.for.a.high.level.spec.fo.a.new.Power.Gain.and.Modulation.measurement.v2.app.docx Notes:
3 Specification of the TR5028 VNA of copper mountains. Food for thoughts https://telemeter.info/de/productattachments/index/download?id=131
|
Hello Pavel,
I am an intensive user of the VNA. It is a great success, thank you very much for your efforts.
At the moment I am using it to measure the Gain of my home made rf power amifier (with adequate attenuators in the input and output path of course)
To measure the rf output power accurately, I can t use the VNA app so I use rf power meters based on AD8307 and 8317 chips. The procedure is accurate but quite tedious as it requires extensive calibration and manual operation to measure accurately the output power of my home made rf amplifier over the whole HF range. I was wondering if instead I could use / modify the VNA client in order to automate the measurement of the output power of my LDMOS amplier in one single sweep between 1 and 54 Mhz (similar to gain short measurement). Of course I assume that some calibration would also be required but instead of doing it manually in Excell as I do it at the moment with my AD8307 and 8317 chips, maybe it could be done by the application based on a "reference power level" at several frequencies.
Is this worthwhile investigating?
Regards
Peter
The text was updated successfully, but these errors were encountered: