How to select Count Property as y-axis for Histogram Plots? #1872
-
|
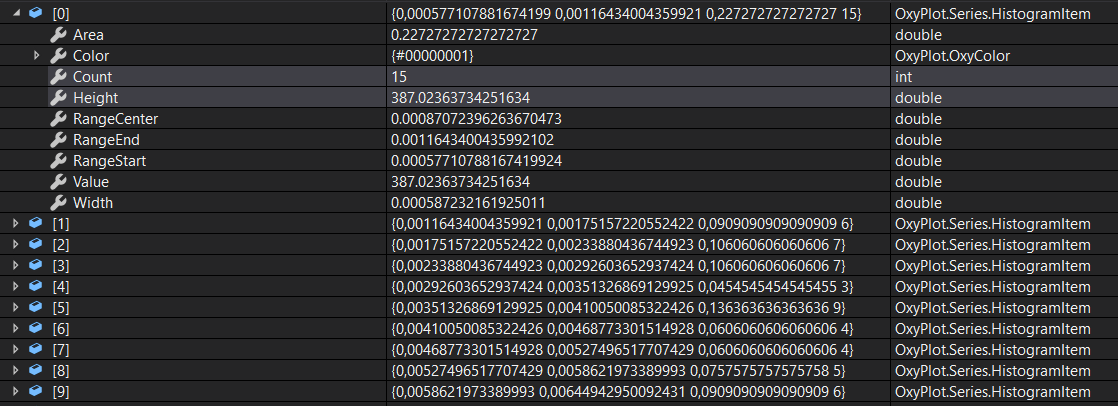
I have the following code: When I put multiple of these series into a Here some HistogramItems:
And here how the plot looks like:
It takes the |

Beta Was this translation helpful? Give feedback.
Replies: 2 comments 10 replies
-
|
|
Beta Was this translation helpful? Give feedback.
-
|
Thank you! This seems very counter intuitive to me. Is it not the usual expectation to have the number of occurrences in each bin as y-axis? |
Beta Was this translation helpful? Give feedback.
-
|
For a bar chart, it would be, but for a histogram it is the area that is the meaningful value (bins concern a continuous range, rather than a discrete category). |
Beta Was this translation helpful? Give feedback.
-
|
I also ran across this. This really not very intuitive and leads to situations where frequency can be >1. |
Beta Was this translation helpful? Give feedback.
-
|
I still think that for complicated scenarios, HistogramItem is overkill. It only needs a single property It feels akward to replicated information with the intention that perhaps someone might need it later. But again, that is probably preference where you want to have complexity. Matplotlib, for example, only takes a "scale" value per bin. That is the value that ends up on the plot. How you come up with scale is your job. |
Beta Was this translation helpful? Give feedback.
-
|
I'd be disinclined to make the binning helpers configurable in this regard (unless we add even more meaningful properties to If this was supported then at present I'd suggest it should be on |
Beta Was this translation helpful? Give feedback.
-
|
@Jonarw I think |
Beta Was this translation helpful? Give feedback.
-
|
Example plots showing the three options: Left is current behaviour (marginal proportion of whole, Code at https://gist.github.com/VisualMelon/ec1c6cb255344e26a88eb569cf622bf6 (uses example from existing example library) Question is whether and how to support the middle and right possibilities in a non-hideous way. |

Beta Was this translation helpful? Give feedback.
-
|
Personally, I am most familiar with the Middle variant (showing the count), which I also find the most intuitive. This is not to say that the other variants don't have their uses, maybe they are more widely used in other fields. So I guess ideally all scenarios would be supported equally. I remember that producing the Count variant is slightly awkward with the current API - you have to calculate the area by count * binwidth, only for the I kind of like the idea of But I also don't see this too critical: The current API does allow for all scenarios, some are just a bit more awkward than others. |
Beta Was this translation helpful? Give feedback.
HistogramSeriesalways usesHeight, computed fromArea. It ignores theCountfor plotting. If you re-project the bins so that theAreaisCount * Widththat should give you what you want, but note that this only makes sense if all histogram items across all histograms use the same bin width.