This page gives you detailed instructions on how to debug code running under .NET Core in VS Code.
File bugs and feature requests here to help us build great tooling for .NET Core.
Install Visual Studio Code (VS Code). Pick the latest VS Code version from here: https://code.visualstudio.com
Install the .NET Core command line tools (CLI) by following the installation part of the instructions here: https://dotnet.microsoft.com/download
Open the command palette in VS Code (press F1) and run Extensions: Install Extensions. Enter C# in the search box and press Enter. Select the extension and click on Install.
If you have previously installed the C# extension, make sure that you have a recent version. You can check this by opening the command palette (press F1) and running Extensions: Show Installed Extensions.
The first time that C# code is opened in VS Code, the extension will download the platform-specific files needed for debugging and editing. Debugging and editor features will not work until these steps finish.
The following steps have to be executed for every project.
You can start from scratch by creating an empty console project with dotnet new. Begin by opening the terminal in Visual Studio Code (View->Integrated Terminal) and type these commands:
cd ~
mkdir MyApplication
cd MyApplication
dotnet new console
See dotnet new --list for a list of all the available project templates.
Go to File->Open Folder (File->Open on macOS) and open the directory in Visual Studio Code. If this is the first time that the C# extension has been activated, it will now download additional platform-specific dependencies.
VS Code needs to be configured so it understands how to build your project and debug it. For this there are two files which need to be added -- .vscode/tasks.json and .vscode/launch.json.
- Tasks.json is used to configure what command line command is executed to build your project, and launch.json configures the type of debugger you want to use, and what program should be run under that debugger.
- Launch.json configures VS Code to run the build task from tasks.json so that your program is automatically up-to-date each time you go to debug it.
If you open the folder containing your project.json, the C# extension can automatically generate these files for you if you have a basic project. When you open a project and the C# extension is installed, you should see the following prompt in VS Code:
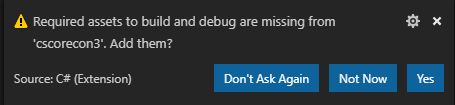
Clicking Yes on this prompt should add these resources.
Creating configuration files manually
If your code has multiple projects or you would rather generate these files by hand, here is how --
.vscode/tasks.json: Start with this example which configures VS Code to launch dotnet build. Update the cwd property if your project isn't in the root of the open folder. If you don't want to build from VS Code at all, you can skip this file. If you do this, you will need to comment out the preLaunchTask from .vscode/launch.json when you create it.
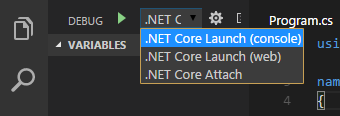
.vscode/launch.json: When you want to start debugging, press the debugger play button (or press F5) as you would normally do. VS Code will provide a list of templates to select from. Pick ".NET Core" from this list and the edit the program property to indicate the path to the application dll or .NET Core host executable to launch. For example:
"configurations": [
	{
		...
		"program": "${workspaceFolder}/MyLaunchingProject/bin/Debug/netcoreapp1.0/MyLaunchingProject.dll",
Your project is now all set. Set a breakpoint or two where you want to stop, click the debugger play button (or press F5) and you are off.
If your code was built on a different computer from where you would like to run in there are a few things to keep in mind --
- Source Maps: Unless your local source code is at exactly the same path as where the code was originally built you will need to add a sourceFileMap to launch.json.
- Portable PDBs: If the code was built on Windows, it might have been built using Windows PDBs instead of portable PDBs, but the C# extension only supports portable PDBs. See the portable PDB documentation for more information.
- Debug vs. Release: It is much easier to debug code which has been compiled in the
Debugconfiguration. So unless the issue you are looking at only reproduces with optimizations, it is much better to use Debug bits. If you do need to debug optimized code, you will need to disable justMyCode in launch.json.
The C# debugger supports attaching to processes. To do this, switch to the Debug tab, and open the configuration drop down.
Select the '.NET Core Attach' configuration. Clicking the play button (or pressing F5) will then try to attach. In launch.json, if processId is set to "" this will provide UI to select which process to attach to.
The debugger supports remotely launching or attaching to processes. See Attaching to remote processes in the wiki for more information.
The VS Code .NET debugger supports configuration options for if the debugger stops when exceptions are thrown or caught. This is done through two different entries in the BREAKPOINTS section of the Run view:
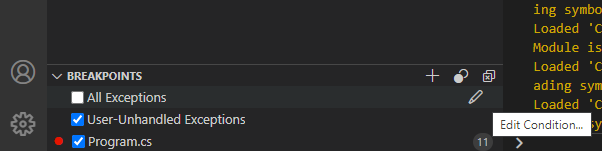
Note that the BREAKPOINTS section will be missing these entries until the first time that the folder has been debugged with the .NET debugger.
Checking 'All Exceptions' will configure the debugger to stop when an exception is thrown. If Just My Code is enabled (which it is by default) the debugger will not break if an exception is internally thrown and caught in library code. Though if the exception is thrown in library code and returned to user code the debugger will break then.
Checking 'User-Unhandled Exceptions' will configure the debugger to stop when an exception is caught in non-user code after having been thrown in user code or traveled through user code. Exceptions that become user-unhandled aren't always a problem, it could be that user code is implementing an API and is expected to raise an exception in this scenario, but it is often a problem. So, by default, the debugger will stop when an exception becomes user-unhandled.
Both checkboxes support conditions to break on only selected exception types. To edit the condition, click on the pencil icon (see image above) or right click on the entry and invoke 'Edit Condition'. The condition is a comma-separated list of exception types to break on, or if the list starts with '!', a list of exception types to ignore.
Examples conditions:
| Example condition value | Result |
|---|---|
| System.NullReferenceException | This will break on just null reference exceptions. |
| System.NullReferenceException, System.InvalidOperationException | This will break on both null reference exceptions and invalid operation exceptions. |
| !System.Threading.Tasks.TaskCanceledException | This will break on all exceptions except for task canceled. |
| !System.Threading.Tasks.TaskCanceledException, System.NotImplementedException | This will break on all exceptions except for task cancelled and not implemented. |