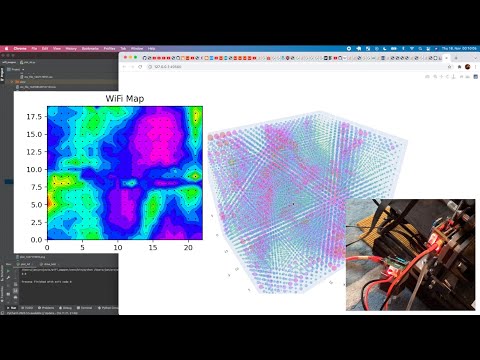
This project is a 3D scanner for WiFi signals.
I built this thing to visualize how WiFi moves through space. To do so I used an old 3D printer frame and an ESP32 NodeMCU. The ESP32 probe was moved in a grid pattern and every 1 cm an RSSI (signal strength) measurement was captured.
The ESP32 was connected to the old print head and hosted an API with the RSSI measurements. The two axis have been controlled by an Ethersweep controller each and a python script collected and visualized the captured data.
What I found interesting was the distance between the light and the dark spots in the plot. They were around 12.5 cm which is the wavelength of 2.4GHz WiFi. Also, I didn't think that such low spec test equipment was able to create a detailed map of how WiFi spreads through space.


- Install the 'node_mcu_code' on the NodeMCU. (change Wifi credentials to your network)
- Open a serial monitor and read the IP of the NodeMCU. Paste it to a browser and test if you get an RSSI readout.
- Take two Ethersweep https://github.com/Neumi/ethersweep controllers (or similar) and build your measurement grid. (might need changes!)
- Test the Ethersweep controllers and adapt the direction and step multiplier settings (steps_per_step)
- Install all missing dependencies (in an venv)
- Start a 2D scan with
python3 drive_2D_grid.py - If everything works you can start an assisted (move third axis by hand after each scan) 3D scan
python3 drive_3D_grid.py - After all images are captured (20 slices took >1h with my setup) you can plot slices
python3 plot.py - ... or 4D
python3 plot_4d.py
If you don't want to build the scanner you can just play with the date in stack_data. Each file is one slice of the scan. First and second values in the CSVs are X and Y, the third value is the RSSI.