React chart components using d3.js

- Time Series (time along x-axis)
- Line Chart (numbers along x-axis)
Time series can render multiple datasets along a single timeline, and takes data of the shape:
var timeseries = {
  series1: [
    {x: '01-May-12', y: 1},
    {x: '30-Apr-12', y: 2},
    {x: '27-Apr-12', y: 3},
    ...
  ],
  series2: [
    {x: '27-Apr-12', y: 5},
    {x: '26-Apr-12', y: 3},
    {x: '25-Apr-12', y: 4},
    ...
  ],
  ...
}
Render it with the configuration you desire:
var margins = { top: 20, left: 30, bottom: 30, right: 20},

React.render(
  <Charts.LineCharts.TimeSeries datasets={timeseries} timeFormat={'%d-%b-%y'} margins={margins} />,
  document.getElementById('chart')
)
Line charts can render multiple datasets along a single x-axis, and takes data of the shape:
var datasets = {
  dataset1: [
    {x: 1, y: 1},
    {x: 2, y: 2},
    {x: 3, y: 3},
    ...
  ],
  dataset2: [
    {x: 4, y: 5},
    {x: 5, y: 3},
    {x: 6, y: 4},
    ...
  ],
  ...
}
Render it with the configuration you desire:
var margins = { top: 20, left: 30, bottom: 30, right: 20},

React.render(
  <Charts.LineCharts.TimeSeries datasets={datasets} margins={margins} />,
  document.getElementById('chart')
)- Thresholds
All configuration:
<Charts.LineCharts.TimeSeries
  datasets={timeseries}        // object {name: [{x: int, y: int}, ...], ...}
  height={height}              // integer
  width={width}                // integer
  ylabel={''}                  // string
  xlabel={''}                  // string
  timeFormat={'%d-%b-%y'}      // string (timeseries only)
  margins={margins}            // object {top: int, left: int, bottom: int, right: int}
  xAxisTickCount={5}           // integer
  yAxisTickCount={3}           // integer
  onMouseEnter={onMouseEnter}  // function
  onMouseLeave={onMouseLeave}  // function
  onMouseClick={onMouseClick}  // function
/>,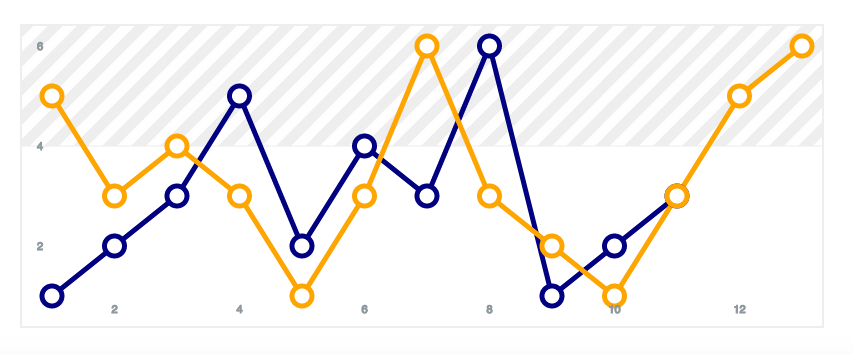
Add a threshold boolean and threshold value (y-axis value) to render the threshold at:
React.render(
  <Charts.LineCharts.LineChart datasets={datasets} threshold={true} thresholdValue={4} />,
  document.getElementById('chart')
)