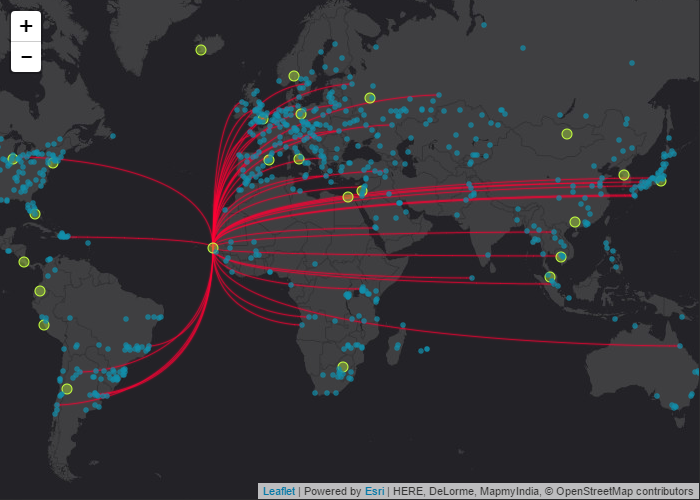
The Leaflet.Canvas-Flowmap-Layer is a custom layer plugin for LeafletJS to map the flow of objects from an origin point to a destination point by using a Bezier curve. GeoJSON point feature coordinates are translated to pixel space so that rendering for the points and curves are mapped to an HTMLCanvasElement.
Demos:
- Simple
- Feature comparison (aka: kitchen sink, sandbox)
- Advanced symbology: class breaks of flowlines
Important!
This is a LeafletJS port of sarahbellum/Canvas-Flowmap-Layer, which was originally written for the ArcGIS API for JavaScript. Go there to learn more!
View our presentation at NACIS 2017.
Table of Contents:
Please see sarahbellum/Canvas-Flowmap-Layer#purpose for more detailed information.
"One-to-many", "many-to-one" and "one-to-one" origin-to-destination relationships are supported by this custom layer.
Important: The developer must format and provide a GeoJSON point feature collection in a specific format. This layer expects that both origin and destination attributes and spatial coordinates are available in each GeoJSON point feature's properties.
Example of a single GeoJSON point feature within a feature collection that includes both origin and destination info:
{
  "type": "Feature",
  "geometry": {
    "type": "Point",
    "coordinates":[109.6091129, 23.09653465]
  },
  "properties": {
    "origin_id": 238,
    "origin_city": "Hechi",
    "origin_country": "China",
    "origin_lon": 109.6091129,
    "origin_lat": 23.09653465,
    "destination_id": 1,
    "destination_city": "Sarh",
    "destination_country": "Chad",
    "destination_lon": 18.39002966,
    "destination_lat": 9.149969909
  }
}
Please see sarahbellum/Canvas-Flowmap-Layer#data-relationships for more details.
The animations rely on the tween.js library to assist with changing the underlying line property values as well as providing many different easing functions and durations. See the setAnimationDuration() and setAnimationEasing() method descriptions below for more information.
Important: If animations are going to be used, then the developer must first load the tween.js library.
<!-- Load animation tweening lib requirement for CanvasFlowMapLayer -->
<script src="https://unpkg.com/@tweenjs/tween.js@18.6.4/dist/tween.umd.js"></script>

<!-- then load CanvasFlowMapLayer -->
<script src="your/path/to/src/CanvasFlowmapLayer.js"></script>You can change how users interact with the Leaflet.CanvasFlowmapLayer by controlling which Bezier curves appear and disappear at any time. The demos we provide show how to do this in several ways with LeafletJS click and mouseover events, coupled with using this layer's selectFeaturesForPathDisplay() method.
For example, you could listen for a click event on an origin point feature—which is displayed on the map as an L.CircleMarker—and then choose to either add to your selection of displayed Bezier curves, subtract from your selection, or establish a brand new selection.
Alternatively, you could set the pathDisplayMode option to 'all' when constructing the layer to display every Bezier curve at once.
The Leaflet.Canvas-Flowmap-Layer has default symbol styles established for origin and destination point L.CircleMarkers, canvas Bezier curves, and animated canvas Bezier curves.
The default symbol styles for origin and destination point L.CircleMarkers can be changed by using the layer constructor option style() method, since this layer extends from L.GeoJSON.
The default symbol styles for canvas Bezier paths and animations can be changed by overriding the layer constructor options for canvasBezierStyle and animatedCanvasBezierStyle, specifically using HTMLCanvasElement stroke and line style property names (instead of LeafletJS marker style properties).
The caveat here is that this Leaflet version of the Canvas-Flowmap-Layer and the Esri-compatible Canvas-Flowmap-Layer both rely on symbol configurations that are defined using property objects inspired by the ArcGIS REST API renderer objects specification. Simple, unique value, and class breaks are all supported but instead use canvas stroke and line style property names. Specifically for this, read about the ArcGIS REST API renderer objects specification.
See the developer API section below and also sarahbellum/Canvas-Flowmap-Layer#symbology for more details. We have provided a demo page of how to set class breaks symbology for Bezier curves.
This extends the LeafletJS v1 L.GeoJSON layer. All properties, methods, and events provided by the L.GeoJSON layer are available in the Leaflet.CanvasFlowmapLayer, with additional custom features described below.
var geoJsonFeatureCollection = {
  // collection of GeoJSON point features
  // with origin and destination attribute properties

  // see discussion above, demos, and CSV example data sources
};

var exampleFlowmapLayer = L.canvasFlowmapLayer(geoJsonFeatureCollection, {
  // required property for this custom layer,
  // which relies on the property names of your own data
  originAndDestinationFieldIds: {
    // all kinds of important stuff here...see docs below

    // however, this isn't required if your own data
    // is in the same format as the layer source code
  },

  // some custom options
  pathDisplayMode: 'selection',
  animationStarted: true,
  animationEasingFamily: 'Cubic',
  animationEasingType: 'In',
  animationDuration: 2000
}).addTo(map);| Property | Description |
|---|---|
originAndDestinationFieldIds |
Required if your data does not have the same property field names as the layer source code. Object. This object informs the layer of your unique origin and destination attributes (fields). Both origins and destinations need to have their own unique ID attribute and geometry definition. See example below which includes minimum required object properties. |
style |
Optional. Function. This function defines the symbol style properties of the origin and destination L.CircleMarker. See example below. |
canvasBezierStyle |
Optional. Object. This object defines the symbol properties of the non-animated Bezier curve that is drawn on the canvas connecting an origin point to a destination point. See Symbology discussion above. |
animatedCanvasBezierStyle |
Optional. Object. This defines the symbol properties of the animated Bezier curve that is drawn on the canvas directly on top of the non-animated Bezier curve. See Symbology discussion above. |
pathDisplayMode |
Optional. String. Valid values: 'selection' or 'all'. Defaults to 'all'. |
wrapAroundCanvas |
Optional. Boolean. Defaults to true. Ensures that canvas features will be drawn beyond +/-180 longitude. |
animationStarted |
Optional. Boolean. Defaults to false. This can be set during construction, but you should use the playAnimation() and stopAnimation() methods to control animations after layer construction. |
animationDuration |
See setAnimationDuration() method description below. |
animationEasingFamily |
See setAnimationEasing() method description below. |
animationEasingType |
See setAnimationEasing() method description below. |
originAndDestinationFieldIds example:
(This is also the default in the layer source code.)
// this is only a default option example,
// developers will most likely need to provide this
// options object with values unique to their data
originAndDestinationFieldIds: {
  originUniqueIdField: 'origin_id',
  originGeometry: {
    x: 'origin_lon',
    y: 'origin_lat'
  },
  destinationUniqueIdField: 'destination_id',
  destinationGeometry: {
    x: 'destination_lon',
    y: 'destination_lat'
  }
}
style example:
(This is also the default in the layer source code.)
style: function(geoJsonFeature) {
  // use leaflet's path styling options

  // since the GeoJSON feature properties are modified by the layer,
  // developers can rely on the "isOrigin" property to set different
  // symbols for origin vs destination CircleMarker stylings

  if (geoJsonFeature.properties.isOrigin) {
    return {
      renderer: canvasRenderer, // recommended to use your own L.canvas()
      radius: 5,
      weight: 1,
      color: 'rgb(195, 255, 62)',
      fillColor: 'rgba(195, 255, 62, 0.6)',
      fillOpacity: 0.6
    };
  } else {
    return {
      renderer: canvasRenderer,
      radius: 2.5,
      weight: 0.25,
      color: 'rgb(17, 142, 170)',
      fillColor: 'rgb(17, 142, 170)',
      fillOpacity: 0.7
    };
  }
}| Method | Arguments | Description |
|---|---|---|
selectFeaturesForPathDisplay( selectionFeatures, selectionMode ) |
selectionFeatures: Array of origin or destination features already managed and displayed by the layer. selectionMode: String. Valid values: 'SELECTION_NEW', 'SELECTION_ADD', or 'SELECTION_SUBTRACT'. |
This informs the layer which Bezier curves should be drawn on the map. For example, you can most easily use this in conjunction with a click or mouseover event listener. |
selectFeaturesForPathDisplayById( uniqueOriginOrDestinationIdField, idValue, originBoolean, selectionMode ) |
This is a convenience method if the unique origin or destination ID value is already known and you do not wish to rely on a click or mouseover event listener. |
|
selectAllFeaturesForPathDisplay() |
This informs the layer to select (and thus show) all Bezier curves. | |
clearAllPathSelections() |
This informs the layer to unselect (and thus hide) all Bezier curves. | |
playAnimation() |
This starts and shows Bezier curve animations. | |
stopAnimation() |
This stops and hides any Bezier curve animations. | |
setAnimationDuration( duration ) |
duration: Optional. Number in milliseconds. |
This changes the animation duration. |
setAnimationEasing( easingFamily, easingType ) |
easingFamily: String. easingType: String. See getAnimationEasingOptions() method for info on valid values. |
This changes the animation easing function with the help of the tween.js library. |
getAnimationEasingOptions() |
Returns information on valid easingFamily and easingType values based on the tween.js library. |
| Event | Description |
|---|---|
click |
Extends layer click and adds the following properties to the event object: isOriginFeature: true if an origin point has been clicked, but false if a destination point has been clicked. sharedOriginFeatures: Array of features that share the same origin. sharedDestinationFeatures: Array of features that share the same destination. |
mouseover |
Extends layer mouseover and adds the following properties to the event object: isOriginFeature: true when the mouse first entered an origin point, but false when the mouse first entered a destination point. sharedOriginFeatures: Array of features that share the same origin. sharedDestinationFeatures: Array of features that share the same destination. |
A copy of the license is available in the repository's LICENSE file.