![]()
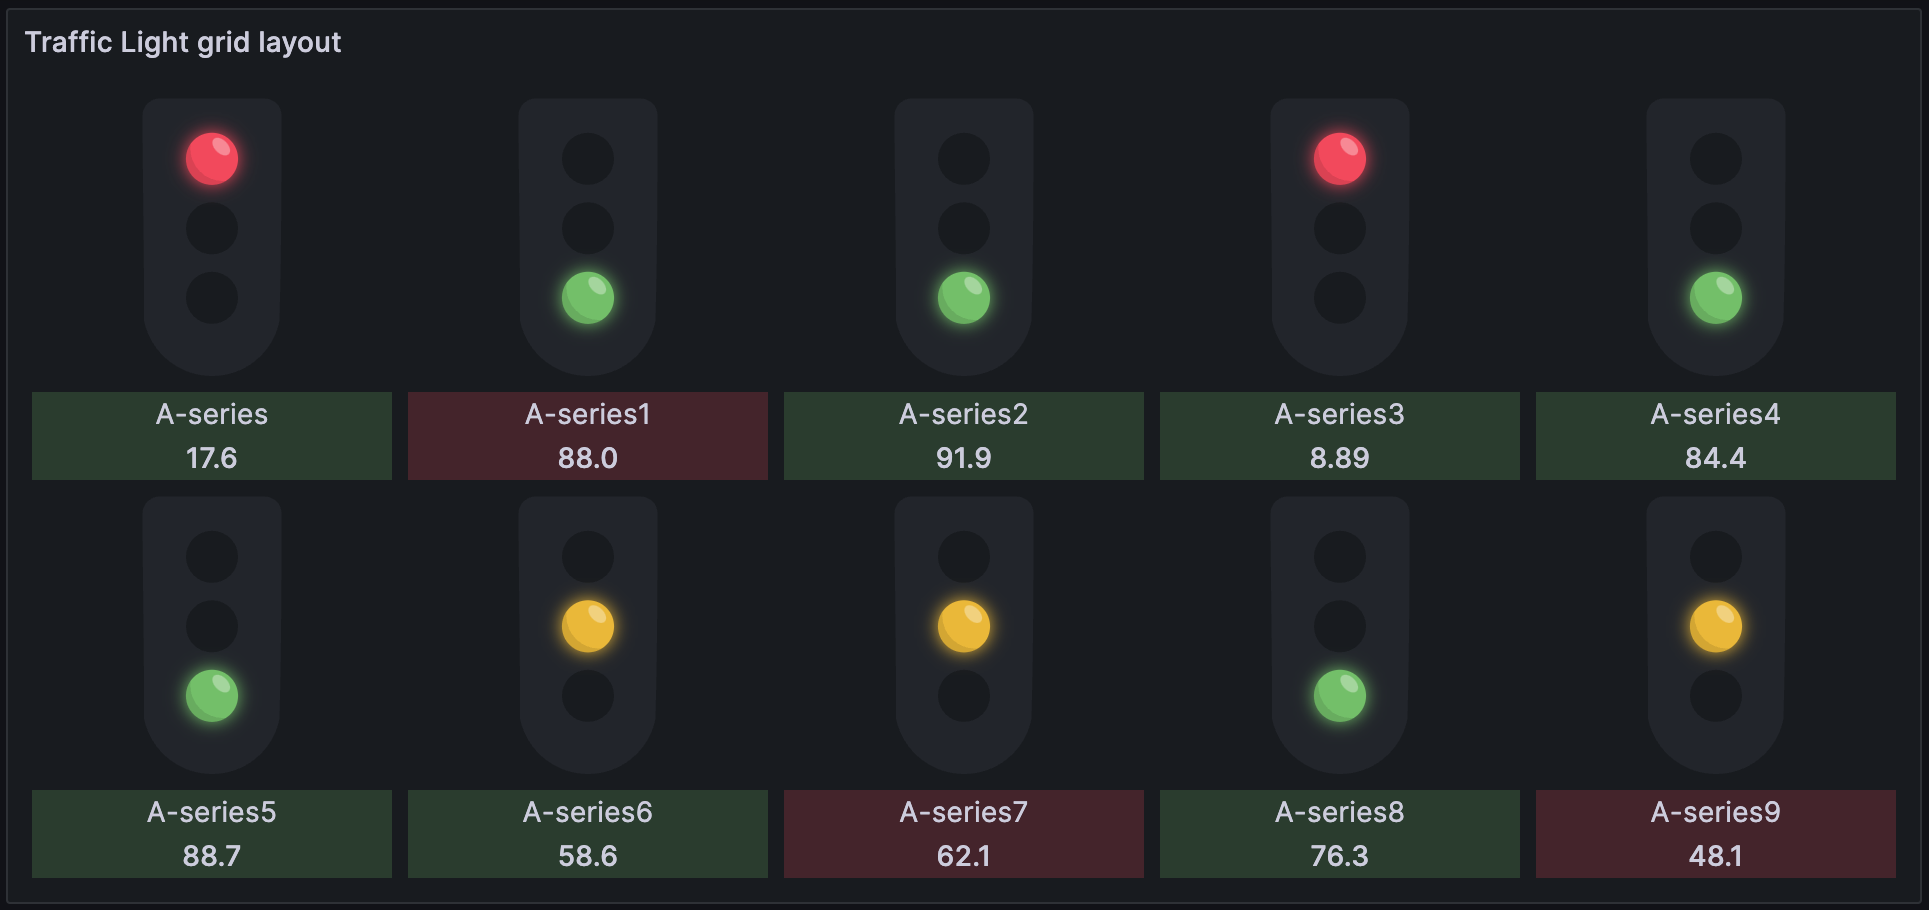
A traffic light to help you interpret complex information at a glance.
Grafana >=9.5.3
- Customizable Traffic Light Width: Set the minimum width for each traffic light.
- Grid/Single Row Layout: Ability to layout lights on a grid or in a single row.
- Reversible light colors: Reverse the order of traffic light colors.
- Sorting Options: Sort the traffic lights based on values in ascending, descending, or series (none) order.
- Value Display: Option to show or hide the values associated with each light.
- Legend Display: Option to show or hide the legend (query name) associated with each light.
- Trend Display: Show or hide the trend color to provide an additional layer of information.
- Traffic Light Style: Pick a style of traffic light.
- Orientation Flexibility: Choose between a vertical or horizontal layout for the traffic lights.
This plugin can be installed using one of the following methods:
- Grafana Plugins Catalog
- Grafana CLI:
grafana-cli plugins install heywesty-trafficlight-panel - Github releases page
The traffic light panel uses the built in Grafana thresholds to assign lights to values.
-
Define Thresholds: In the plugin settings, define thresholds that categorize your data. A basic thresholds example for a traffic light looks like:

-
Assign Colors: Assign colors to each threshold range. These colors will be used to represent the corresponding data values in the traffic lights.
-
Preview and Adjust: After setting the thresholds, preview them on your dashboard. Adjust the thresholds and colors as necessary to accurately reflect the status indicated by your data.
-
Data Links: Optionally add datalinks to make the traffic light panel navigate elsewhere on click.
Tip
Make use of threshold overrides if you'd like to set traffic lights with different colour schemes.
Getting started is as simple as adding the panel to your dashboard and tweaking a few settings:
- Minimum Light Width: Decide how big your traffic lights should be for clear visibility. The default setting is 100 pixels.
- Single Row View: By default each light will flow in an auto grid layout. This can be controlled by adjusting the minimum light width. Enable this if you'd prefer to keep all lights on one row.
- Reverse Light Color: Due to Grafana auto sorting thresholds, this option caters for situations where the "base" threshold should be considered "go" and the highest threshold should be considered "stop".
- Show Value: Choose whether to display the numerical values with each light. True by default.
- Show Legend: Choose whether to display the numerical values with each light. True by default.
- Show Trend: Add an extra layer of insight with a trend color. True by default.
- Traffic Light Style: Choose from one of: default, rounded, or side lights.
- Sort Lights: Organize your traffic lights in the order that makes sense to you:
- None: Keep data series order.
- Ascending: Line them up from lowest to highest values.
- Descending: Line them up from highest to lowest values.
- Orientation: Set the lights horizontally or stick to the default vertical layout.
Check the datasource is returning data from the query.
The plugin supports any data source that returns data frame(s) containing one numeric field.
Thresholds need to be set for the plugin to operate. Please see usage section above. Thresholds must contain base and two other values. One for each light.