Skip to content
New issue

Have a question about this project? Sign up for a free GitHub account to open an issue and contact its maintainers and the community.

By clicking “Sign up for GitHub”, you agree to our terms of service and privacy statement. We’ll occasionally send you account related emails.

Already on GitHub? Sign in to your account

Memory leak on 4.0.x (at least - .21) - on adapter level when a lot of logs forwarded to Seq (ZigBee with Debug) #1888

Open
PeterVoronov opened this issue Apr 12, 2022 · 17 comments
Labels

Comments

@PeterVoronov
Copy link

PeterVoronov commented Apr 12, 2022

I faced with issue with ZigBee adapter - periodically it was restarted due to JavaScript heap out of memory.
Initially it was an idea about issues inside the adapter, but after log term studying the situation I found the root cause outside the adapter - such issues was happened only in case of enabling forwarding logs to Seq and Debug level of logging on the adapter or Seq level.
So, it looks like, in case of massive log generation some memory not freed and after growing used memory up to threshold - adapter was restarted.

host.iot-main |   | 2022-04-03 15:04:24.403 | error | Caught by controller[20]: 18: 0x98c58c [io.zigbee.0]
host.iot-main |   | 2022-04-03 15:04:24.403 | error | Caught by controller[19]: 17: 0x7f58f4f17d0a __libc_start_main [/lib/x86_64-linux-gnu/libc.so.6]
host.iot-main |   | 2022-04-03 15:04:24.403 | error | Caught by controller[18]: 16: 0xa03805 node::Start(int, char**) [io.zigbee.0]
host.iot-main |   | 2022-04-03 15:04:24.403 | error | Caught by controller[17]: 15: 0xa7b642 node::NodeMainInstance::Run() [io.zigbee.0]
host.iot-main |   | 2022-04-03 15:04:24.402 | error | Caught by controller[16]: 14: 0x13c13f8 uv_run [io.zigbee.0]
host.iot-main |   | 2022-04-03 15:04:24.402 | error | Caught by controller[15]: 13: 0x13d3014 [io.zigbee.0]
host.iot-main |   | 2022-04-03 15:04:24.402 | error | Caught by controller[14]: 12: 0x13c0aa6 [io.zigbee.0]
host.iot-main |   | 2022-04-03 15:04:24.402 | error | Caught by controller[13]: 11: 0xaab749 node::PerIsolatePlatformData::FlushForegroundTasksInternal() [io.zigbee.0]
host.iot-main |   | 2022-04-03 15:04:24.402 | error | Caught by controller[12]: 10: 0xaa98e4 node::PerIsolatePlatformData::RunForegroundTask(std::unique_ptr<v8::Task, std::default_delete<v8::Task> >) [io.zigbee.0]
host.iot-main |   | 2022-04-03 15:04:24.401 | error | Caught by controller[11]: 9: 0xcae3bb non-virtual thunk to v8::internal::CancelableTask::Run() [io.zigbee.0]
host.iot-main |   | 2022-04-03 15:04:24.401 | error | Caught by controller[10]: 8: 0xde4c3c v8::internal::ScavengeJob::Task::RunInternal() [io.zigbee.0]
host.iot-main |   | 2022-04-03 15:04:24.401 | error | Caught by controller[9]: 7: 0xd853ab v8::internal::Heap::CollectGarbage(v8::internal::AllocationSpace, v8::internal::GarbageCollectionReason, v8::GCCallbackFlags) [io.zigbee.0]
host.iot-main |   | 2022-04-03 15:04:24.401 | error | Caught by controller[8]: 6: 0xd7756f [io.zigbee.0]
host.iot-main |   | 2022-04-03 15:04:24.401 | error | Caught by controller[7]: 5: 0xd769e5 [io.zigbee.0]
host.iot-main |   | 2022-04-03 15:04:24.400 | error | Caught by controller[6]: 4: 0xbba7d7 v8::internal::V8::FatalProcessOutOfMemory(v8::internal::Isolate*, char const*, bool) [io.zigbee.0]
host.iot-main |   | 2022-04-03 15:04:24.400 | error | Caught by controller[5]: 3: 0xbba45e v8::Utils::ReportOOMFailure(v8::internal::Isolate*, char const*, bool) [io.zigbee.0]
host.iot-main |   | 2022-04-03 15:04:24.400 | error | Caught by controller[4]: 2: 0x970199 node::FatalError(char const*, char const*) [io.zigbee.0]
host.iot-main |   | 2022-04-03 15:04:24.400 | error | Caught by controller[3]: 1: 0xa3aaf0 node::Abort() [io.zigbee.0]
host.iot-main |   | 2022-04-03 15:04:24.400 | error | Caught by controller[2]: FATAL ERROR: Ineffective mark-compacts near heap limit Allocation failed - JavaScript heap out of memory
host.iot-main |   | 2022-04-03 15:04:24.399 | error | Caught by controller[1]: <--- JS stacktrace --->
host.iot-main |   | 2022-04-03 15:04:24.399 | error | Caught by controller[1]: [1068189:0x480ec00] 129482604 ms: Mark-sweep 2032.6 (2053.7) -> 2030.5 (2053.7) MB, 367.9 / 0.0 ms (average mu = 0.132, current mu = 0.067) allocation failure scavenge might not succeed
host.iot-main |   | 2022-04-03 15:04:24.399 | error | Caught by controller[1]: [1068189:0x480ec00] 129482209 ms: Mark-sweep 2032.6 (2053.5) -> 2030.5 (2053.7) MB, 325.9 / 0.0 ms (average mu = 0.193, current mu = 0.121) allocation failure scavenge might not succeed
host.iot-main |   | 2022-04-03 15:04:24.398 | error | Caught by controller[1]: <--- Last few GCs --->
  • Adapter Version - 1.6.16
  • Node Version - v14.19.1
  • js-controller version - 4.0.21
  • System information:
    top - 16:07:28 up 15 days, 21:17, 1 user, load average: 0.77, 0.85, 0.76
    Tasks: 253 total, 5 running, 248 sleeping, 0 stopped, 0 zombie
    %Cpu(s): 3.6 us, 1.5 sy, 0.0 ni, 94.7 id, 0.1 wa, 0.0 hi, 0.1 si, 0.0 st
    MiB Mem : 7876.6 total, 855.8 free, 5919.8 used, 1100.9 buff/cache
    MiB Swap: 7628.0 total, 5092.7 free, 2535.3 used. 1580.3 avail Mem

image

@foxriver76
Copy link
Collaborator

Which db type? iob status

@Apollon77
Copy link
Collaborator

ANd does the chart mean that you switched off debug logging or seq logging at all ?

@PeterVoronov
Copy link
Author

Which db type? iob status

Objects type: jsonl
States type: jsonl

ANd does the chart mean that you switched off debug logging or seq logging at all ?

currently Seq is still enabled, but debug status on ZigBee adapter is switched off...
Memory usage grow only when both thing are on - Seq and Debug.
I have debug on two telegram instances, but amount of logged data not comparable with ZigBee, it is100 times less, at least ...

@AlCalzone
Copy link
Collaborator

So basically when you have a lot of logs going through Seq, correct?

@arteck
Copy link

arteck commented Apr 13, 2022

hmm strange. i use also seq ..and iobroker in redis/redis
my log level in zigbe is Info
grafik

@PeterVoronov
Copy link
Author

PeterVoronov commented Apr 13, 2022

hmm strange. i use also seq ..and iobroker in redis/redis my log level in zigbe is Info grafik

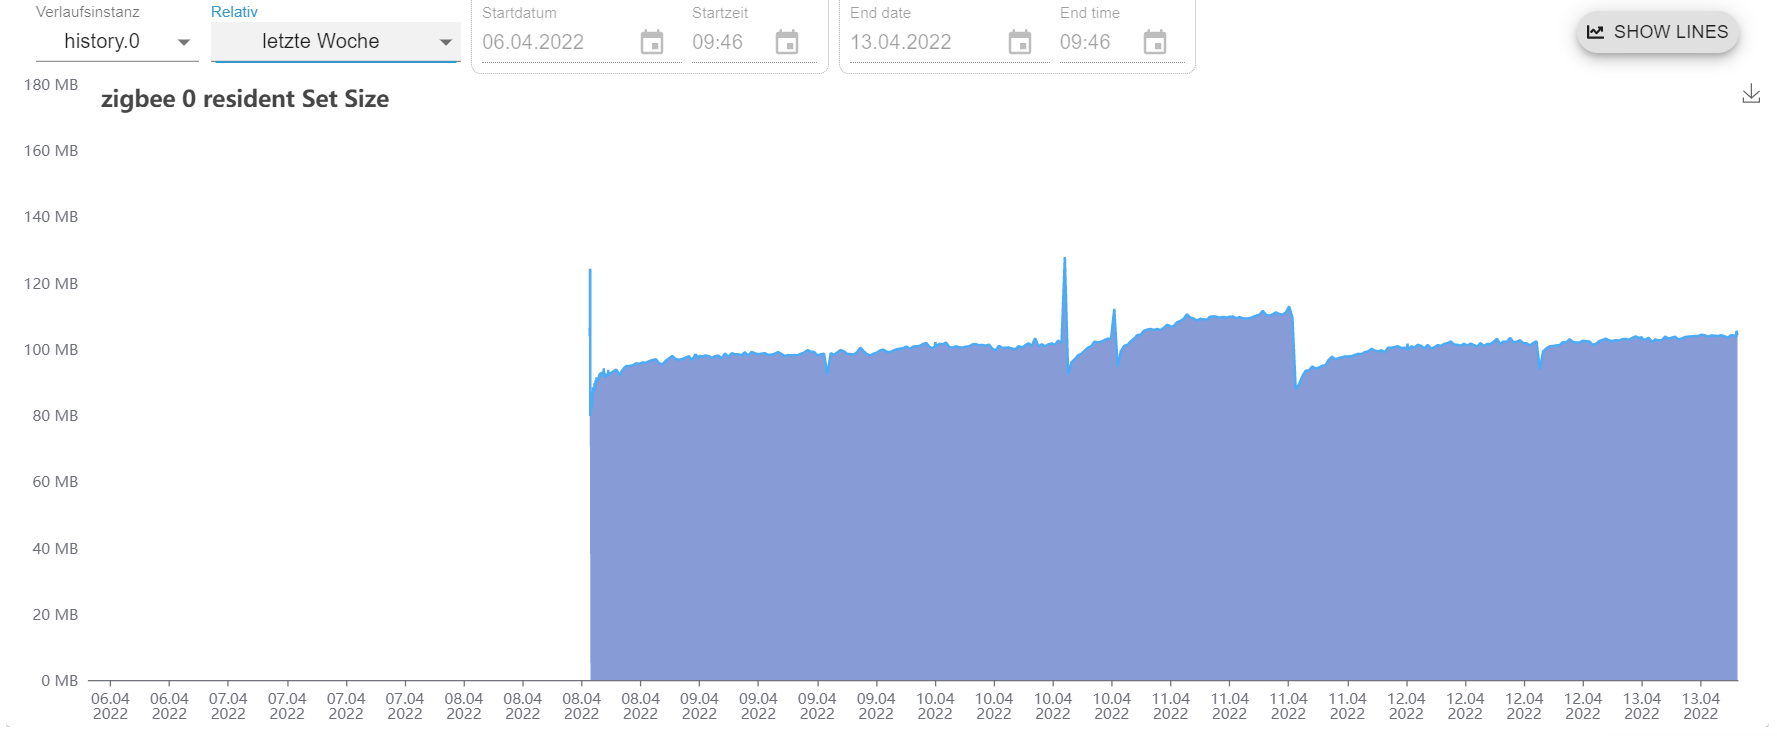
As I wrote - the issues is only when debug level is enabled for ZigBee.
with info - everything is ok, due to low amount of the logs itself.

"So, it looks like, in case of massive log generation some memory not freed and after growing used memory up to threshold - adapter was restarted."
See image below ...

So basically when you have a lot of logs going through Seq, correct?

Yes, sure. but what is strange for me - the memory leaked on adapter level ...

image

@PeterVoronov PeterVoronov changed the title Memory leak on 4.0.x (at least - .21) and Debug and forwarding logs to Seq Memory leak on 4.0.x (at least - .21) - on adapter level when a lot of logs forwarded to Seq (ZigBee with Debug) Apr 13, 2022
@Apollon77
Copy link
Collaborator

@PeterVoronov Whats the seq config? Can You please copy that part out of iobroker-data/iobroker.json? especially interesting is the "Loglevel" setting there. is it empty or set to anything?

@PeterVoronov
Copy link
Author

@PeterVoronov Whats the seq config? Can You please copy that part out of iobroker-data/iobroker.json? especially interesting is the "Loglevel" setting there. is it empty or set to anything?

      "seq1": {
        "type": "seq",
        "enabled": true,
        "level": "",
        "serverUrl": "http://127.0.0.1:5341",
        "apiKey": "",
        "eol": ""
      }

As I wrote previously, it happened in two situations:

  1. the log level for Seq is set to "Debug" - so, from all adapters all messages with level from "debug" are forwarded to Seq;
  2. the log level of Seq is set to "Default", i.e. - "level": "", and ZigBee adater log level set to "Debug", i.e. only all messages from ZigBee with level from "debug" are forwarded to Seq
    In both cases - it is a lot of log messages, and in my case ZigBee generate at least 90% ....

And there is Seq config

image

@Apollon77
Copy link
Collaborator

@PeterVoronov Would you up for a bit testing? ;-)

We do da deepClone of the log object in https://github.com/ioBroker/ioBroker.js-controller/blob/master/packages/common/src/lib/common/logger.ts#L96 (buut in general for all loglevels) ... One idea would be to adjuust the generated js file on your system to have "ioInfo = null" after the super call. The file should be in @iobroker/js-controller-common

@PeterVoronov
Copy link
Author

@PeterVoronov Would you up for a bit testing? ;-)

We do da deepClone of the log object in https://github.com/ioBroker/ioBroker.js-controller/blob/master/packages/common/src/lib/common/logger.ts#L96 (buut in general for all loglevels) ... One idea would be to adjuust the generated js file on your system to have "ioInfo = null" after the super call. The file should be in @iobroker/js-controller-common

I'm ready. Only one thing - I'm not fully understand what I have to do ...

@PeterVoronov
Copy link
Author

And ? What I have to do?

@Apollon77
Copy link
Collaborator

Ok, then lets go :-)

  • cd /opt/iobroker
  • find -name "logger.js"|grep "@iobroker/js-controller-common"
  • there should be only one match on last command, open this file in editor
  • go to line 95 and insert a new line AFTER that line (so after the "super.log(ioInfo, callback);")
  • add "ioInfo = null;" there
  • save and see if that changed anything. Thank you

@PeterVoronov
Copy link
Author

Ok, then lets go :-)

  • cd /opt/iobroker
  • find -name "logger.js"|grep "@iobroker/js-controller-common"
  • there should be only one match on last command, open this file in editor
  • go to line 95 and insert a new line AFTER that line (so after the "super.log(ioInfo, callback);")
  • add "ioInfo = null;" there
  • save and see if that changed anything. Thank you

Ok. I did it. will monitor.

But, I'm not sure, will it help, or not, due to in original /@iobroker/js-controller-common/lib/common/logger.js this ioInfo declared as a const at line 64.
It throw error on start on iobroker. I changed the declaration to let, to have possibility to start iob...

@Apollon77
Copy link
Collaborator

Thank you, yes I missed that you also need to adjust this. Good catch.

I fear that the "clone" migth be the issue ...

@PeterVoronov
Copy link
Author

Thank you, yes I missed that you also need to adjust this. Good catch.

I fear that the "clone" migth be the issue ...

Unfortunately the behavior is the same - memory usage is growing tremendously...
Screenshot_2022-04-26-00-21-34-432_com android chrome

@foxriver76
Copy link
Collaborator

Has anything changed with controller v5 on this behavior or still occurring?

@PeterVoronov
Copy link
Author

Has anything changed with controller v5 on this behavior or still occurring?

Not testes, but I still have seq docker image on the same maschine - will check nearest time.

Sign up for free to join this conversation on GitHub. Already have an account? Sign in to comment
Labels
Projects
None yet
Development

No branches or pull requests

5 participants